A couple of weeks ago we were looking for an entry point to go short (we found it at Dow Jones 16,100), now we are evaluating how far this correction has to go.
The Dow Jones (DJI: ^DJI) is already within striking distance of our first down side target and the S&P 500 (SNP: ^GSPC) is getting close.
How Low Can Stocks Go?
First off, based on the current sentiment extremes stocks can go much lower, so there may well be surprises to the down side.
But unless technical support for the S&P 500 and Dow Jones is broken, odds favor an upcoming buying opportunity.
The ratio between 1-month and 3-month volatility may tell us how long it will be before a potential buying opportunity.
The chart below plots the S&P 500 against the ratio between the VIX (Chicago Options: ^VIX) and 3-month volatility.
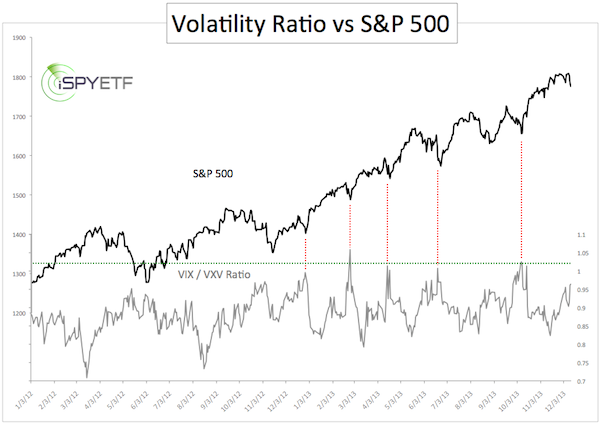
As the green line denotes, a spike to about 1 has been a good level to go long throughout 2013. The current reading is 0.96.
If the ratio hits 1, it may also be time to buy the S&P 500 ETF (NYSEArca: SPY) or other stocks/ETFs and short the iPath S&P 500 VIX ETN (NYSEArca: VXX) or buy VXX put options.
VXX generally suffers from contango when the VIX trades below 25. Contango in essence erodes the value of VXX over time (click here for an explanation of VXX contango).
VIX seasonality is also a huge help for anyone looking to trade the VIX. The only up to date VIX seasonality chart on the web can be found here: VIX Seasonality Chart
I will continue to monitor the VIX/VXV ratio and share my findings via the Profit Radar Report. If you want to be one of the first ones to find out when the ratio hits 1, feel free to sign up here for the Profit Radar Report.
Simon Maierhofer is the publisher of the Profit Radar Report. The Profit Radar Report presents complex market analysis (stocks, gold, silver, euro and bonds) in an easy format. Technical analysis, sentiment indicators, seasonal patterns and common sense are all wrapped up into two or more easy-to-read weekly updates. We are accountable for our work, because we track every recommendation (see track record below).
Follow Simon on Twitter @ iSPYETF or sign up for the FREE iSPYETF Newsletter to get actionable ETF trade ideas delivered for free.

|
