 Market analysts and forecasters can’t be picky or biased. You can’t cherry pick data to support a bias. The tail doesn’t wag the dog and any forecast needs to be data driven. Market analysts and forecasters can’t be picky or biased. You can’t cherry pick data to support a bias. The tail doesn’t wag the dog and any forecast needs to be data driven.
A ton of data and indicators go into each Profit Radar Report update. There are different sentiment measures, various seasonalities and cycles and a wide variety of technical indicators.
Candle formations are one of the technical indicators I look at. I don’t follow them religiously, but they often add weight to the message conveyed by other indicators.
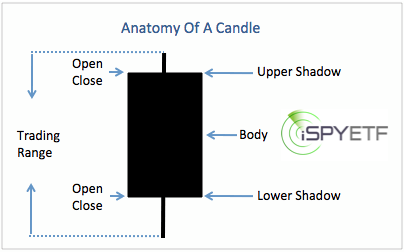
Anatomy of a Candle
Let’s review the anatomy of a candle before we look at a never before seen candle formation for the SPDR S&P 500 ETF (SPY).
The image below shows the main components of a candle: Open/close price, body, upper/lower shadow (also called wig) and the trading range (green or yellow, depending on up or down day).
The Only SPY Triple Outside Day
On Wednesday, the SPDR S&P 500 ETF or SPY opened below the low of the past three days and closed above the high of the past three days. This is called a triple outside day and has never happened before (see chart below).
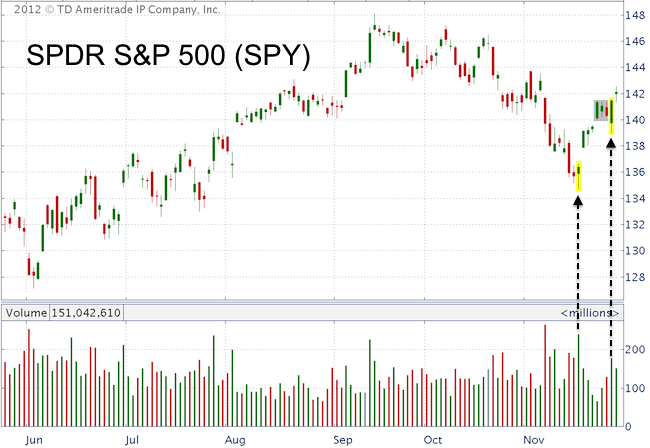
That’s a curious factoid, but has it any directional implications? It just might. There have been seven double outside days. Each of them led to positive performance of the next couple of weeks.
Trading volume also picked up on Wednesday. Elevated volume increases the message of any candle formation, which suggests that this rally is not yet over.
 A recent article here on iSPYETF.com (Nov. 19: Is it Time to Buy Apple Again?) referred to a reversal candle for AAPL at 506 and concluded that: "Prices are likely to move higher" (Apple traded as high as 595 since). A recent article here on iSPYETF.com (Nov. 19: Is it Time to Buy Apple Again?) referred to a reversal candle for AAPL at 506 and concluded that: "Prices are likely to move higher" (Apple traded as high as 595 since).
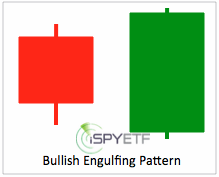
The November 18 Profit Radar Report spotted a similar reversal candle in combination with a bullish engulfing pattern (see image on the left) in the S&P 500 and stated that: “the immediate down trend is exhausted and stocks are ready to bounce.” The S&P is up as much as 80 points since. This bounce will continue and quite possible morph into a sizeable rally as long as prices remain above support.
Before we snub our noses at funny sounding candle formations, we should remember that they just called an 80-point (S&P 500) turn around.
|
