Today the Nasdaq-100 ETF (Nasdaq: QQQ) rallied to a new 14-year high, while the iShares Russell 2000 ETF (Nasdaq: IWM) trades about 4.5% below its all-time high.
The S&P 500 ETF (NYSEArca: SPY) retraced about 75% of its recent decline while the Dow Jones ETF (NYSEArca: DIA) only retraced about 55%.
Not all indexes always move in the same direction to the same extent, but there’s something odd about the current divergence in structure.
Here’s what I mean:
One of the many indicators and types of analysis I follow is Elliott Wave Theory (EWT). EWT is the oddball of technical analysis, but it provides certain insights no other indicator can.
One of the unique features of EWT is the interpretation of waves. Most market moves are categorized as either 5-wave or 3-wave moves.
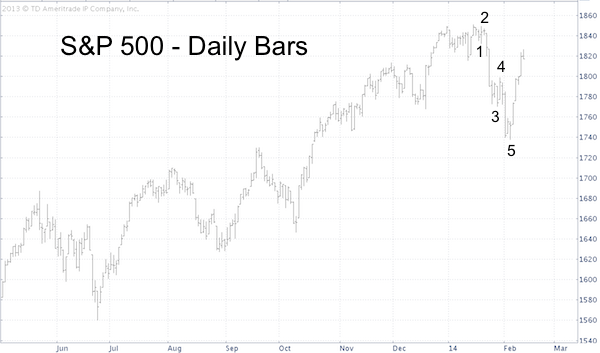
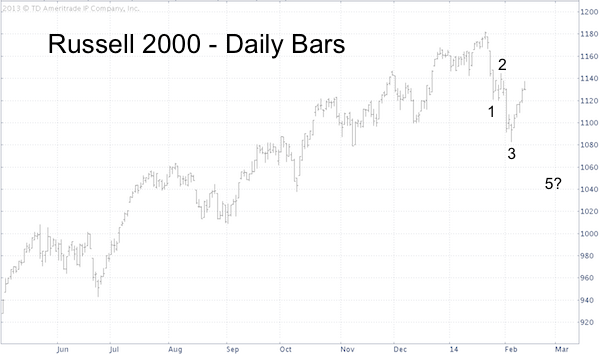
Following the strong 2013 rally, a 5-wave move to the down side would suggest further down side, while a 3-wave move lower suggests the correction is finished.
Here’s the conflict:
EWT interpretation of the S&P 500 chart: Following its January 15 high, the S&P 500 traced out five waves to the down side.
EWT interpretation of the Dow Jones chart: Following its December 31 high, the Dow Jones slumped lower in five (somewhat sloppy) waves.

EWT interpretation of the Russell 2000 chart: After its January 22 high, the Russell 2000 dropped in three waves.
EWT interpretation of the Nasdaq-100: After its January 22 high, the Nasdaq-100 declined in three waves.
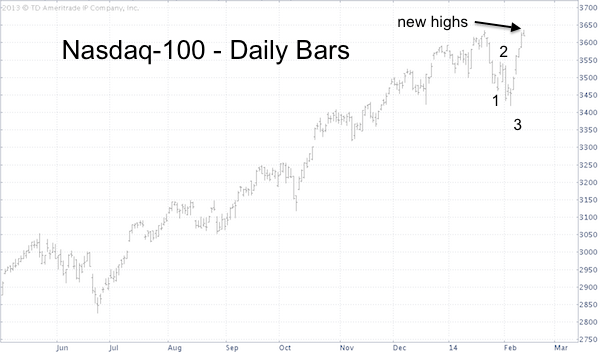
Based on the EWT wave pattern of the S&P 500 and Dow Jones new lows are likely, but the wave pattern of the Russell 2000 and Nasdaq-100 point to new highs.
Based on a combination of technical analysis and EWT the February 5 Profit Radar Report projected the S&P 500's expected path as outlined by the yellow lines.
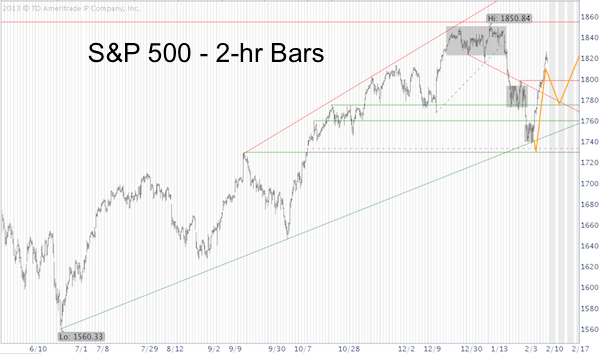
The February 9 Profit Radar Report proposed that: "Bounces have been quite strong during this QE bull market. The strongest resistance (and target for this bounce) is at 1,830." The February 12 Profit Radar Report pointed out that there is an open chart gap at 1,845. Open chart gaps often act as magnets.
Thus far the S&P 500 has adhered to the Profit Radar Report’s projection rather closely and is about to hit a ‘make it or break it’ resistance level.
The S&P 500 and in particularly the Dow Jones offer clear resistance levels. If broken, they will lead to new highs and a continued rally.
But new lows are likely if the S&P 500 and Dow Jones struggle to overcome their respective resistance levels. This presents a low-risk trading opportunity with a high potential reward.
The Profit Radar Report reveals the ‘make it or break it’ resistance levels along with the corresponding trade setups. Subscribers also gain access to a full 2014 Forecast along with a specific price projection (like the one above, but long-term).
Simon Maierhofer is the publisher of the Profit Radar Report. The Profit Radar Report presents complex market analysis (S&P 500, Dow Jones, gold, silver, euro and bonds) in an easy format. Technical analysis, sentiment indicators, seasonal patterns and common sense are all wrapped up into two or more easy-to-read weekly updates. All Profit Radar Report recommendations resulted in a 59.51% net gain in 2013.
Follow Simon on Twitter @ iSPYETF or sign up for the FREE iSPYETF Newsletter to get actionable ETF trade ideas delivered for free.

|
