Every once and a while it’s a good idea to check equity money flows, kind of like a GPS for what the money is doing.
Here’s a series of three charts to help us do just that.
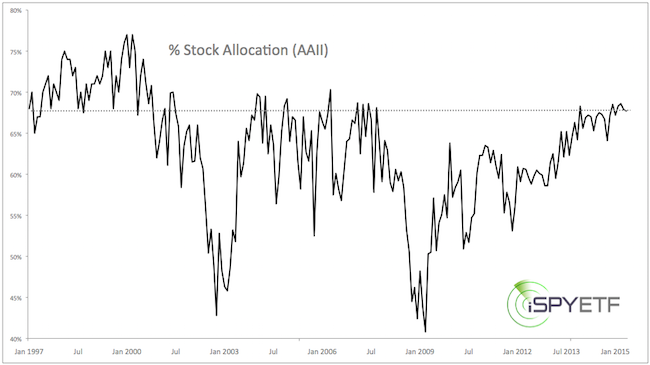
1) Asset Allocation
In March, exposure to stocks (according to the American Association for Individual Investors asset allocation survey) soared to the highest level since the 2007 financial crisis.
This sounds scary, but the long-term asset allocation chart helps put things into perspective. Leading up to the 2000 market top, investors had up to 77% of their portfolio in stocks, and up to 69% in 2007.
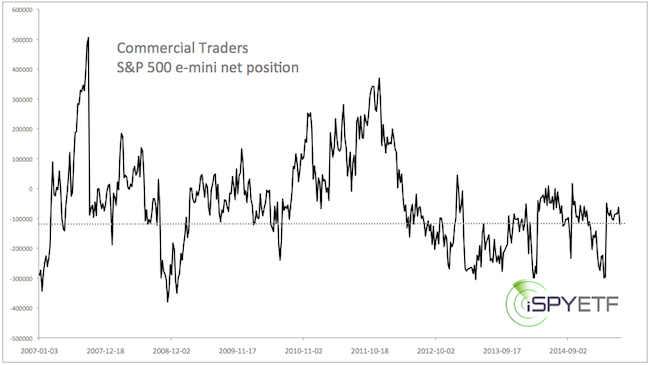
2) Commercial Traders
The chart below shows the net S&P 500 e-mini futures contracts held by commercial traders. On balance, commercial traders are more or less neutral.
If you enjoy quality, hand-crafted research, >> Sign up for the FREE iSPYETF Newsletter
3) VIX, Put/Call Ratio, SKEW
Chart #3 plots the S&P 500 against three different sentiment indicators:
-
CBOE SKEW: The SKEW was designed to measure the risk of a ‘Black Swan’ event. Higher SKEW = higher risk.
-
CBOE Equity Put/Call Ratio: This ratio shows to what extent option traders favor call options over put option. Lower readings = more optimism = more risk.
-
CBOE Volatility Index (VIX): The mix shows the market’s expectation of 30-day volatility. Lower VIX = Elevated risk. The VIX has lost much of its contrarian indicator mojo starting in 2012.
If you enjoy quality, hand-crafted research, >> Sign up for the FREE iSPYETF Newsletter
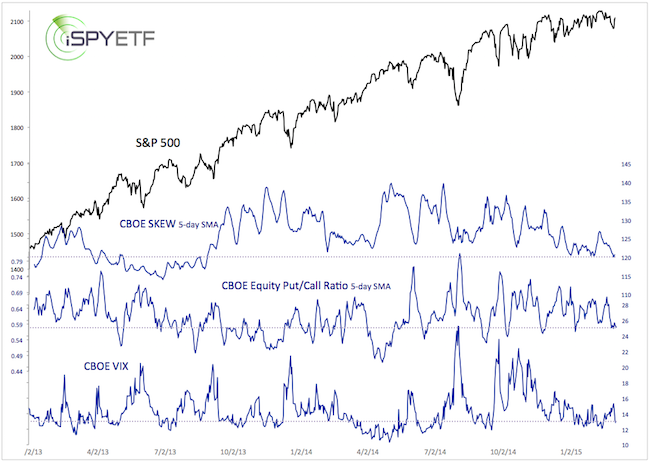
The CBOE SKEW (5-day SMA to smooth out daily swings) is near the lower end of a two-year range.
The CBOE equity put/call ratio dropped to 0.46 yesterday, a 1-year low. The 5-day SMA is not as low, but still at the lower end of an eight-month range.
The VIX is back to what used to be considered the ‘danger zone.’
Summary:
Money is flowing into equities, but there are no screaming investor sentiment extremes. Anyone claiming that stocks will crash because any one single sentiment gauge is at financial crisis levels is taking things out of context.
Detailed investor sentiment analysis is available to Profit Radar Report subscribers.
Simon Maierhofer is the publisher of the Profit Radar Report. The Profit Radar Report presents complex market analysis (S&P 500, Dow Jones, gold, silver, euro and bonds) in an easy format. Technical analysis, sentiment indicators, seasonal patterns and common sense are all wrapped up into two or more easy-to-read weekly updates. All Profit Radar Report recommendations resulted in a 59.51% net gain in 2013 and 17.59% in 2014.
Follow Simon on Twitter @ iSPYETF or sign up for the FREE iSPYETF Newsletter to get actionable ETF trade ideas delivered for free.

If you enjoy quality, hand-crafted research, >> Sign up for the FREE iSPYETF Newsletter
|
