We’ve been tracking the triangle formation that kept the S&P 500 range bound for several weeks.
The last free S&P 500 forecast (April 15: S&P 500 Trapped in Range – Why and How Long?) summarized the situation as follows:
“If the S&P is not strongly rejected by the upper triangle boundary, it will probably continue ‘triangling’ around and eventually break higher. Even if stocks break higher though, they may soon come back ... perhaps to test the lower end of the range.”
Here is an updated look at the triangle, seasonality and supply & demand:
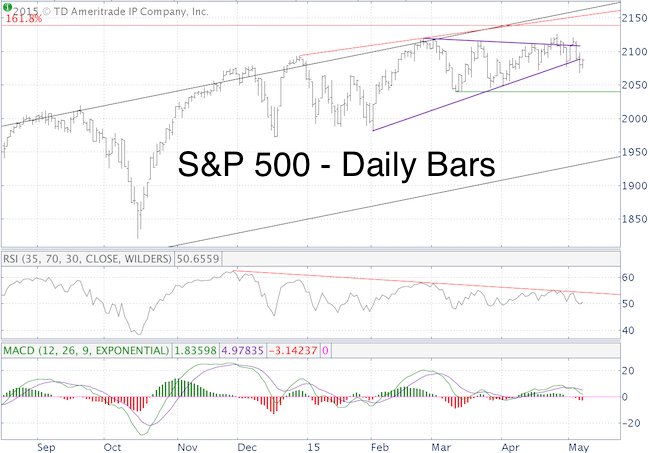
The S&P tried to break above the triangle, but ultimately failed, and is now just below prior triangle support.
As per the April 22 Profit Radar Report, this failed breakout was almost expected:
“Based on technical analysis, a break above S&P 2,112 and Nasdaq 4,465 - 4,485 would be bullish. The bearish S&P divergences suggest tight risk management to protect against a fakeout breakout. If the breakout is successful, up side appears limited. Aggressive investors may trade a break above resistance (such as QQQ above 109.10) or go short while resistance holds.”
Never Miss a Beat! >> Sign up for the FREE iSPYETF e-Newsletter
The RSI graph, included in the chart above, illustrates the bearish RSI divergence.
The percentage of stocks above their 50-day SMA also failed to confirm the latest S&P high and strongly suggested internal deterioration (view chart here).
MACD (shown above) triggered another sell signal on Tuesday.
Seasonality is turning bearish (my S&P 500 seasonality chart is shown on page 2 of this Forbes article).
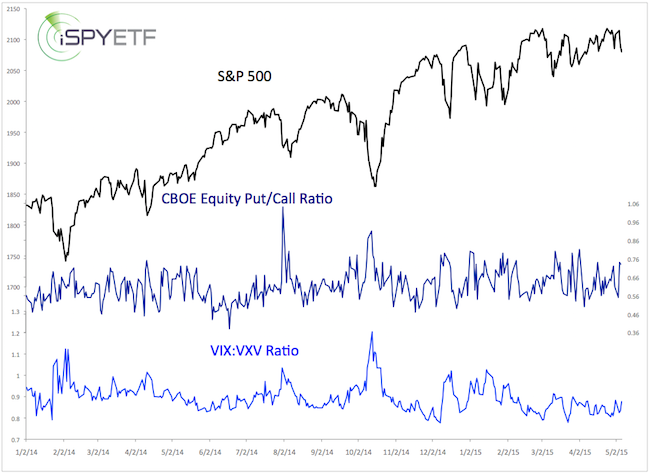
Yesterday, the equity put/call ratio and VIX:VXV ratio spiked to levels that caused bounces in the past (chart below published in yesterday’s Profit Radar Report).
However, demand for stocks has been falling as supply picked up. Tuesday’s drop on heavy volume right after an attempt at new highs is a negative (high volume declines after a period of selling can be exhaustion moves, but high volume declines after new highs tend to be more of a ‘kick off’ move).
The S&P 500 is still in the chopping ranging, so pegging a reliable resistance level is tough, but I would watch S&P 2,090 and the red resistance line on the RSI graph. A move above RSI resistance would make another S&P all-time high possible.
In summary, selling the bounces seems to be the best approach right now. The question is, how big will the next bounce be?
Continued S&P 500 analysis is available via the Profit Radar Report.
Simon Maierhofer is the publisher of the Profit Radar Report. The Profit Radar Report presents complex market analysis (S&P 500, Dow Jones, gold, silver, euro and bonds) in an easy format. Technical analysis, sentiment indicators, seasonal patterns and common sense are all wrapped up into two or more easy-to-read weekly updates. All Profit Radar Report recommendations resulted in a 59.51% net gain in 2013 and 17.59% in 2014.
Follow Simon on Twitter @ iSPYETF or sign up for the FREE iSPYETF Newsletter to get actionable ETF trade ideas delivered for free.

Never Miss a Beat! >> Sign up for the FREE iSPYETF e-Newsletter
|
