On February 7 gold prices exceeded trend line resistance (dashed red line) that capped every prior breakout attempt.
The breakout is highlighted by the blue oval.
On February 9, the Profit Radar Report stated that: “Gold is chipping away at trend line resistance. The odds now favor a spike higher as long as there’s no close below 1,254. Key resistance and possible near-term target is at the descending trend line/trend channel resistance around 1,340.”
The February 17 Profit Radar Report refined the up side target: “Ultimately gold may move higher towards 1,360 or even 1,400.”
Gold is close to the up side target and the March 16 Profit Radar Report warned of excessive optimism, so there are a few things worth considering:
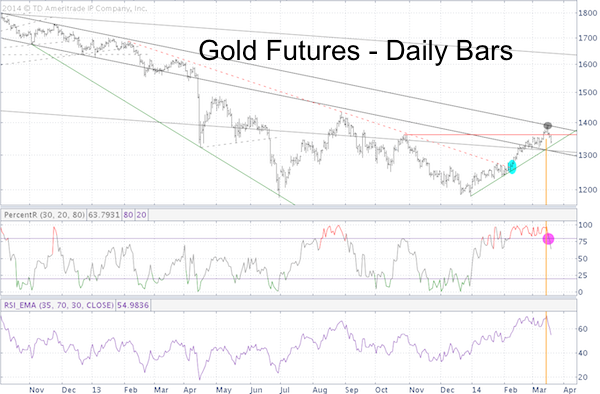
1) On March 14 gold closed at a new recovery high. This recovery high was confirmed by RSI (yellow line), which is generally considered bullish.
However, prior highs (August and October 2013) were also accompanied by a new RSI high and didn’t prevent further declines.
2) On March 17 gold touched the upper side of an ‘old’ trend channel and reversed (gray circle).
3) Tuesday’s decline triggered a ‘bullish percentR low-risk entry (pink circle). The initial drop of percentR below the 80 line (pink oval) is generally considered an opportunity to buy as long as trade doesn’t close below that day’s low (1,351). The corresponding ‘failure level’ for the SDPR Gold Shares (NYSEArca: GLD) is 130.33, for the iShares Gold Trust (NYSEArca: IAU) 13.11.
A close below 1,351 will be a failed bullish low-risk entry. Over the past year, every failed low-risk entry resulted in further losses. Next support is the green trend line at 1,326.
It may be too early to bury this gold rally (there is still a possible higher target - see March 16 Profit Radar Report), but sentiment strongly suggests that the next bigger surprise will be to the down side.
Here is a piece of gold (and GLD, IAU) sentiment analysis that may surprise you and put a smirk on your face at the same time.
Gold Rally - New Bull Market or Bull Trap?
Simon Maierhofer is the publisher of the Profit Radar Report. The Profit Radar Report presents complex market analysis (S&P 500, Dow Jones, gold, silver, euro and bonds) in an easy format. Technical analysis, sentiment indicators, seasonal patterns and common sense are all wrapped up into two or more easy-to-read weekly updates. All Profit Radar Report recommendations resulted in a 59.51% net gain in 2013.
Follow Simon on Twitter @ iSPYETF or sign up for the FREE iSPYETF Newsletter to get actionable ETF trade ideas delivered for free.

|
