The S&P 500 (SNP: ^GSPC) is incapacitated by a sentiment tug of war.
Every trading day awakens to doomsday prophets, spreading their bearish gospel.
Ironically, doomsday prophets are right. Many trustworthy indicators have indeed pointed to a sizeable correction … and yet they’ve been so wrong.
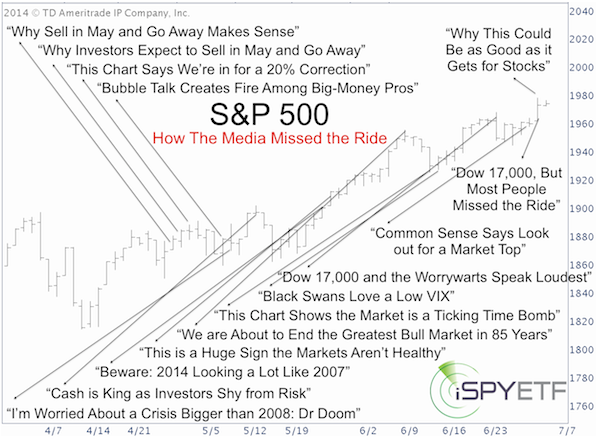
When Will This ‘Broken Clock’ Be Right?
Even a broken clock is right twice a day, but the S&P 500 headline chart below shows that the media at large has been wrong, very wrong, for very long.
Fear the Fear Mongers, Not the VIX
One of the reasons many have been expecting a market crash is because of the VIX, which was recently at an 88-month low. The ‘original VIX’ even dropped to an all-time low. The chart below plots VXO against the S&P 500 (NYSEArca: SPY).
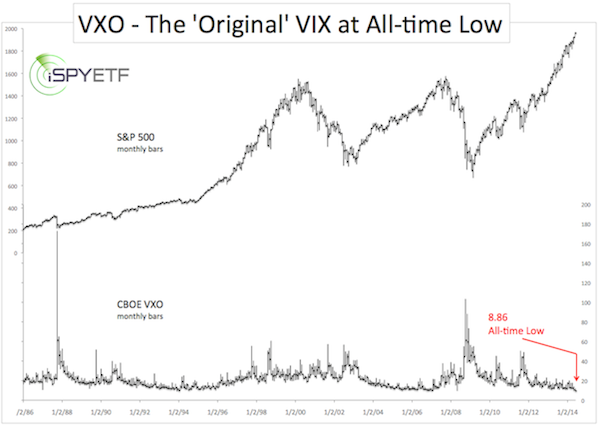
The original VIX – VXO - is now known as the CBOE S&P 100 Volatility Index. In 2003, the original VIX was renamed VXO and replaced by the VIX as we know it today. VXO is essentially the VIX for the biggest large cap stocks.
By now every novice investor and their grandma ‘knows’ that a low VIX leads to major market tops. But that reasoning couldn’t be more flawed.
On June 16, the Profit Radar Report exposed this false line of reasoning with three powerful charts in a controversial report: “The VIX is too LOW for a major market top”.
Regardless of the VIX implications for the S&P 500, it reflects a level of complacency that contradicts the financial press’ pessimism.
Sentiment Divergence
Investor sentiment is a powerful contrarian indicator, but current sentiment gauges are all over the map.
The image below quantifies the level of analysis paralysis among investors better than any other chart.
It plots the S&P 500 against the spread between two different sentiment polls. The Investors Intelligence (II) survey of investment advisors and the American Association for Individual Investors (AAII) survey of retail investors.
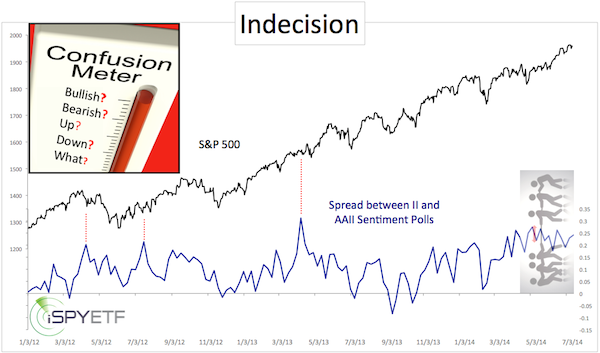
Advisors are predominantly bullish, investors neutral to bearish. The divergence between both opinions has rarely been more visible and is more persistent than at any other time in recent history.
Who should we trust? The media? Investment advisors? Retail investors?
Conclusion
No doubt, hindsight will bring the answer. Based on the current fragmentation, both bulls and bears will likely have a tough time to stage a sustainable move.
It will probably take a ‘tiebreaker’ to unlodge the trading range. A break of support should give bears the upper hand in this struggle (otherwise expect a grind higher).
The Profit Radar Report used an unconventional indicator to identify key support more than two weeks ago. Since then it’s been tested (and proven correct) five times.
Here’s a free look at key support and the analysis usually reserved for subscribers of the Profit Radar Report.
S&P 500 Outlook: S&P Bounces from Support
Simon Maierhofer is the publisher of the Profit Radar Report. The Profit Radar Report presents complex market analysis (S&P 500, Dow Jones, gold, silver, euro and bonds) in an easy format. Technical analysis, sentiment indicators, seasonal patterns and common sense are all wrapped up into two or more easy-to-read weekly updates. All Profit Radar Report recommendations resulted in a 59.51% net gain in 2013.
Follow Simon on Twitter @ iSPYETF or sign up for the FREE iSPYETF Newsletter to get actionable ETF trade ideas delivered for free.

|
