On May 20, we looked at an indicator that has the distinct reputation of signaling the 2000 and 2007 meltdowns ("A Look at the Risk Off Gauge That Correctly Signaled the 2000 and 2007 Tops") .
Since then, this indicator has delivered a surprising twist.
We are talking about the XLY:XLP ratio.
XLY represents the Consumer Discretionary Select Sector SPDR ETF. XLP represent the Consumer Staples Select Sector SPDR ETF.
Consumer discretionary is an economically sensitive, high-octane sector. Consumer staples is an economically defensive sector.
The XLY:XLP ratio reflects how much risk investors are willing to take.
The chart below plots the S&P 500 against the XLY:XLP ratio.
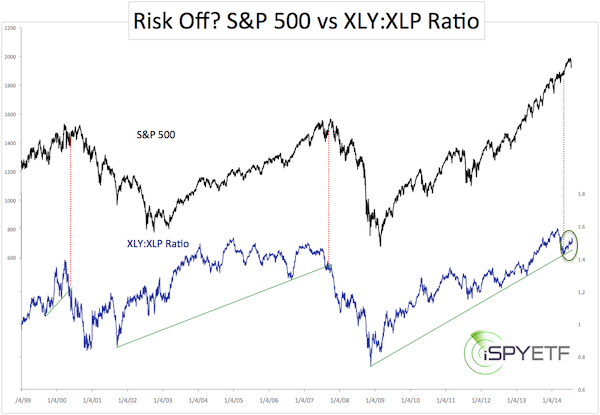
In late February, XLP started to outperform XLY (‘risk off’ mentality’). This led to a falling ratio. By May, the XLY:XLP ratio was on the verge of breaking below the trend line support.
Such a breach of trend line support foreshadowed the 2000 and 2007 rallies.
But then something curious happened. XLY recovered and so did the ratio.
Defensive sectors tend to fair better during poor markets, but despite the most recent selloff, which knocked the S&P 500 (NYSEArca: SPY) from 1,990 to 1,910, investors actually preferred XLY over XLP.
Why? I don’t know.
At the end of the day, a ‘market crash’ signal (like in 2000 and 2007) was averted.
The XLY:XLP ratio is just one of many indicators used to analyze the market and assess the (much talked about) risk of a market crash.
The Profit Radar Report just published an article on the most accurate ‘market crash vs correction’ indicator. This indicator correctly anticipated the 1987, 2000 and 2007 crash. At the same time, it exposed the 2010, 2011 and 2012 corrections as temporary blips.
More information is available here: How to Discern a Major Market Top
Simon Maierhofer is the publisher of the Profit Radar Report. The Profit Radar Report presents complex market analysis (S&P 500, Dow Jones, gold, silver, euro and bonds) in an easy format. Technical analysis, sentiment indicators, seasonal patterns and common sense are all wrapped up into two or more easy-to-read weekly updates. All Profit Radar Report recommendations resulted in a 59.51% net gain in 2013.
Follow Simon on Twitter @ iSPYETF or sign up for the FREE iSPYETF Newsletter to get actionable ETF trade ideas delivered for free.

|
