The S&P 500 (SNP: ^GSPC) has rallied 100 points in the last 10 days.
That’s nice trivia, but the weekly S&P 500 bar chart (figure 2) shows something more significant.
The S&P 500 (NYSEArca: SPY) has finally reached trend channel resistance going all the way back to the March 2009 low.
This trend channel served as a natural magnet for prices, that’s why the Profit Radar Report has been following the channel since early 2013.
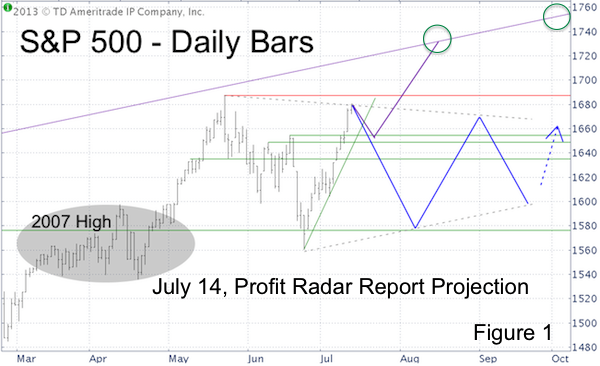
The July 14, Profit Radar Report featured two possible paths the S&P 500 could take to ultimately reach the channel.
-
“A brief correction followed by the next rally leg to 1,700 – 1,750 (purple projections). Somehow my gut tells me it won’t be that easy.”
-
“A prolonged period (4 – 8 weeks) of frustrating and unpredictable range bound up and down moves (blue projections) may be the markets way to play cat and mouse with investors and digest the strong gains since November 2012 and June 24, 2013. The longer the sideways action, the higher the next target (due to the ascending trend channel).”
The S&P 500 (NYSEArca: IVV) chose option #2, the cat and mouse path. But regardless of the path, the destination has been reached. What now?
Mission Accomplished
The S&P 500 has captured the long-standing Profit Radar Report’s up side target and accomplished this mission.
As the chart shows, the upper line of the trend channel has acted as natural resistance for the S&P 500 (NYSEArca: VOO) in the past and repelled stocks.
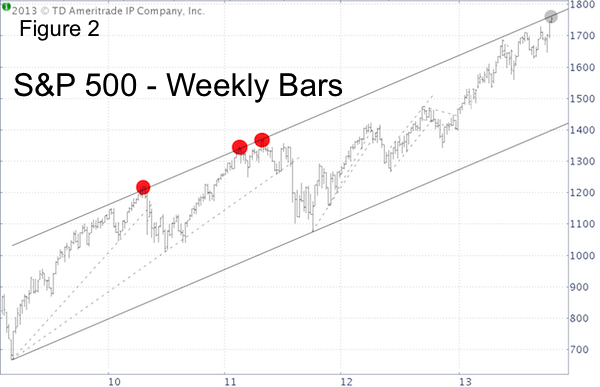
But past performance is no guarantee of future results.
If the S&P 500 is going to reverse, it should do so right around trend channel resistance. In fact, the effect of the channel resistance is being felt today.
However, I am seeing a number of indicators that suggest any reversal will be only temporary in nature, with the growing potential of higher price targets.
One indicator that suggests continued (although not uninterrupted) strength for the S&P 500 is VIX (Chicago Options: ^VIX) seasonality. In fact, VIX seasonality is quite pronounced.
A simple but comprehensive VIX seasonality chart is available here: VIX Seasonality Chart
As always, I will share my findings and buy/sell signals via the Profit Radar Report.
Simon Maierhofer is the publisher of the Profit Radar Report.
|