On June 15, I noticed (and wrote) that 2015 is Shaping up to Look a lot Like 2011.
In 2011, the S&P 500 fell 20% in July/August. 18% of that loss happened within a 3-week meltdown.
The rearview mirror shows a similar ‘crash’ in August 2015. Will the 2011/2015 analogy continue?
I suspect it will. Not tick for tick, nothing every does, but reasonably close.
The chart below plots the S&P 500 of 2011 (black line) against the S&P 500 of 2015 (blue line).
In 2011, the initial low (August 9 at 1,101.54) was followed by a multi-week consolidation and another new low (October 4 at 1,074.77).
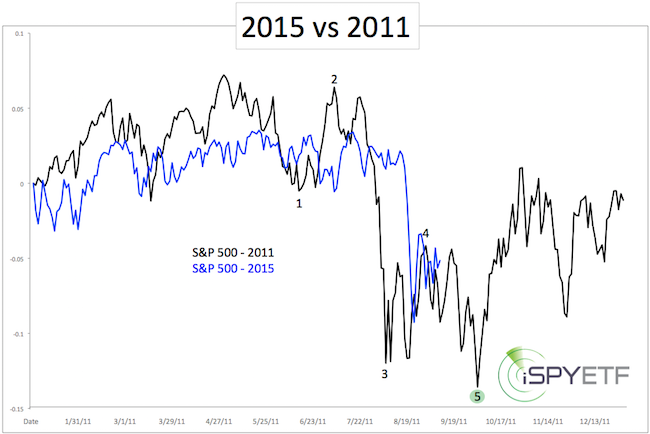
According to Elliott Wave Theory (EWT), the 2011 decline followed a 5-wave format (see black numerical labels). Elliott Wave Theory is an exotic indicator, and should not be followed blindly, but there are times when EWT can be very helpful.
If you enjoy quality, hand-crafted research, >> Sign up for the FREE iSPYETF Newsletter
Now appears to be such a time.
A complete 5-wave decline, as happened in 2011, usually means two things:
-
A bounce (or rally to new highs) is next
-
A longer-term trend change may have occurred (this was not the case in 2011).
Regardless, a rally was to be expected after the initial (wave 3) low.
I noted via the August 24 Profit Radar Report that: “It looks like today’s low (1,867 for the S&P 500) marks the end of wave 3. Next should be a choppy and potentially violent wave 4 rebound.”
There are a number of other possibilities, but at this point there is no reason to complicate matters. If the next moves don’t match our parameters (many of which were already shared with Profit Radar Report subscribers), we’ll adjust.
For now, the likely path is the one outlined by the 2011 template: Perhaps more choppy sideways action, and a new low followed by a Q4 rally.
Simon Maierhofer is the publisher of the Profit Radar Report. The Profit Radar Report presents complex market analysis (S&P 500, Dow Jones, gold, silver, euro and bonds) in an easy format. Technical analysis, sentiment indicators, seasonal patterns and common sense are all wrapped up into two or more easy-to-read weekly updates. All Profit Radar Report recommendations resulted in a 59.51% net gain in 2013 and 17.59% in 2014.
Follow Simon on Twitter @ iSPYETF or sign up for the FREE iSPYETF Newsletter to get actionable ETF trade ideas delivered for free.

If you enjoy quality, hand-crafted research, >> Sign up for the FREE iSPYETF Newsletter
|
