Research studies show that investors as a group buy high and sell low. The media fuels this kind of crowd behavior, trashing stocks near a bottom and hyping them up near the top.
The “headline index” - a fictitious index based on a not entirely worthless evaluation of media sentiment – depicts a media more cheery than any other time in 2012. The upside is limited whenever the media is implying a sustainable rally.
But this article isn’t about sentiment or the media; it’s about a technical divergence. One that incidentally runs contrary to the media’s blissful mood.
RSI Basics
The Relative Strength Index (RSI) is a very basic and commonly used momentum indicator. I usually don’t subscribe to popular indicators (the more folks use any given indicator the less effective it is), but RSI just happens to work very well for me (perhaps because I use an unusual setting to make it more ‘special’).
My simple theory is to look for unconfirmed highs or lows. Any new price high/low unconfirmed by a new RSI high/low is a bearish/bullish divergence. This theory works at multiple time frames. I like to use it for spotting highs/lows that last for weeks or months.
This simple strategy has helped me to identify the May 2011 top and October 2011 and June 2012 lows.
Bearish RSI Divergence
The chart below is visual evidence that every bigger top since 2010 (vertical dashed red lines) sported a bearish RSI divergence (new price high without new RSI high).
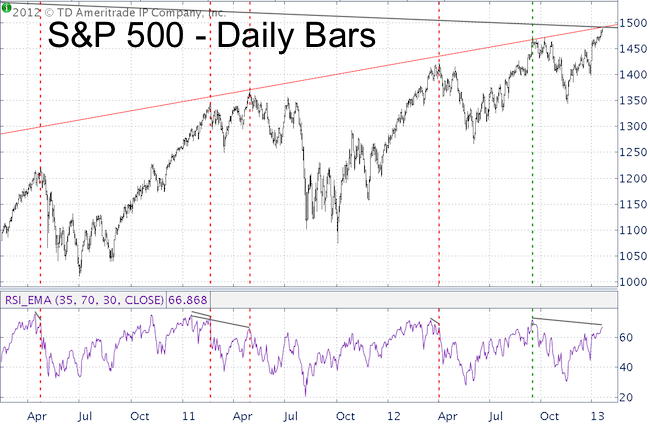
The September 14 high fooled me, because there was no bearish divergence (dashed green line). Due to the lack of divergence, I refused to abandon my outlook for new recovery highs above 1,475, which at the time was quite unpopular.
Via the September 30, Profit Radar update I stated that: “The September 14 recovery highs for the S&P, Dow, Russell 2000, and XLF were all accompanied by new RSI highs. It would be rare for stocks to form a long-term peak without a bearish price/RSI divergence. Because of this lack of divergence we expect new recovery highs.”
The December 2, Profit Radar update again noted that: “The decline from September 14 – November 16 was a correction on the S&P’s journey to new recovery highs. This scenario is supported by the lack of bearish price/RSI divergences at the September 14 high, continuous QE liquidity, and bullish seasonality. There is no specific target, but any new recovery high marked by a bearish price/RSI divergence could mark the end of this rally.”
Something’s Changed
As of last week, the S&P 500 recorded new recovery highs above 1,475 void of a new RSI high. In itself, that’s not a sell signal, but it’s a red flag.
As with any indicator, RSI divergences become more potent when confirmed by other technical indicators or support/resistance levels.
I was excited to discover two important resistance levels not far above current trade. In fact, one of the resistance levels caused a major S&P 500 reversal in May 2011, one that shaved nearly 300 points off the S&P.
It can be treacherous to buck a QE-stock market on a mission, but this major inflection point along with the bearish RSI divergence and increasingly bullish sentiment suggests definite caution ahead.
The Profit Radar Report reveals the key resistance level (and target for this rally) along with conservative and aggressive trade recommendations to take advantage if this strong inflection point.
|
