The Russell 2000 Index (Chicago Options: ^RUT) of small cap companies just sliced below double support (see insert in Russell 2000 chart below).
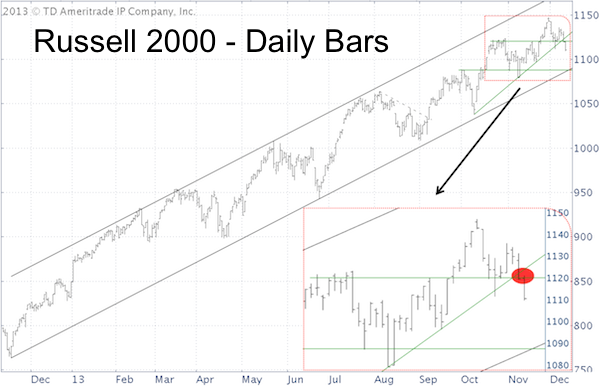
Support was well defined and the breach was more than a tentative brief dip below support, so why may it be deceptive?
Small cap stocks tend to outperform large cap stocks in the second half of December.
This small cap specific seasonality enhances the general bullish seasonal December bias for stocks.
Strong December seasonality has one ‘chink in the armor’ and that’s the early part of the month.
Based on this seasonal pattern, a clear technical resistance level, and excessive bullish sentiment, the November 27 Profit Radar Report anticipated the following:
“A temporary correction in early December is becoming more and more likely. We are looking to sell longs and go short if our Dow Jones short trigger is filled.”
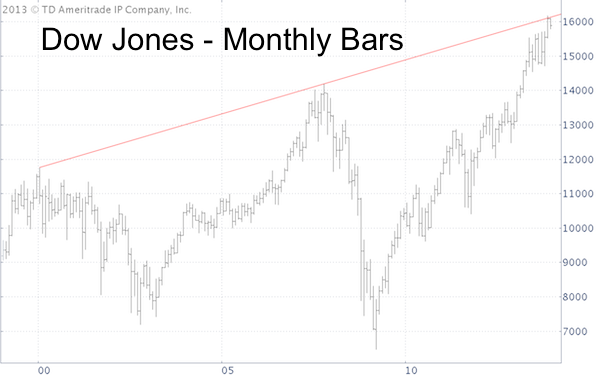
The Dow Jones short trigger was filled when the Dow hit long-term resistance at 16,150 (see Dow Jones chart below). At the same time we closed our long S&P 500 position at 1,810.
Strong support for the Russell 2000 is around 1,090. The corresponding support of the iShares Russell 2000 ETF (NYSEArca: IWM) is around 108.
Support is only support as long as it lasts (and bullish sentiment would certainly allow for a deeper correction), but early indicators suggest that a buying opportunity for the Russell 2000, Dow Jones ETF (NYSEArca: DIA), and S&P 500 ETF (NYSEArca: SPY) might be coming up if stocks can stay above support.
I will continue to monitor the upcoming price action and corresponding buy/sell signals and share the results via the Profit Radar Report.
A detailed short-term analysis for the S&P 500 and Dow Jones is available here:
S&P 500 and Dow Jones Short-term Forecast with a Twist
Simon Maierhofer is the publisher of the Profit Radar Report. The Profit Radar Report presents complex market analysis (stocks, gold, silver, euro and bonds) in an easy format. Technical analysis, sentiment indicators, seasonal patterns and common sense are all wrapped up into two or more easy-to-read weekly updates. We are accountable for our work, because we track every recommendation (see track record below).
Follow Simon on Twitter @ iSPYETF or sign up for the FREE iSPYETF Newsletter to get actionable ETF trade ideas delivered for free.

|
