Money velocity is the frequency at which one dollar changes hands and is used to buy goods and services within a given period of time.
To illustrate we’ll look at two simplified mock economies:
The Federal Reserve prints $100 to buy Treasuries from banks (NYSEArca: XLF). The bank invests the $100 in stocks.
A consumer withdraws $100 from his bank account to pay his mechanic. The mechanic takes his wife out for a nice dinner and the restaurant uses the money to pay its staff and buy new equipment. After receiving her pay check the waitress goes out and buys a new watch.
The original $100 in the second mock economy changed hands four times (high velocity) and helped support three additional individuals/businesses once in circulation.
The conclusion is obvious: The higher the velocity, the healthier the economy.
Below is a chart of the U.S. money velocity. The St. Louis Fed money velocity data goes back as far as 1959. Current money velocity is at an all-time low.
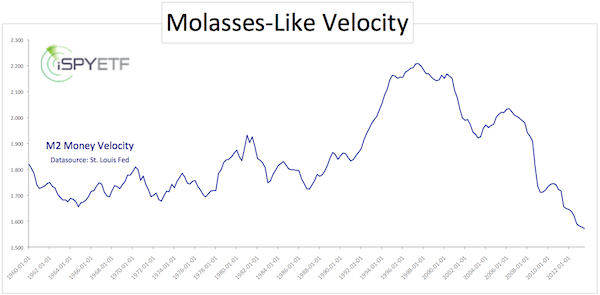
This can’t be good for the economy and one would think that low money velocity couldn’t be good for the stock market either. Is that so?
Rather than assume, here are the facts.
The second chart plots the S&P 500 (SNP: ^GSPC) against the money velocity of M2 money stock.
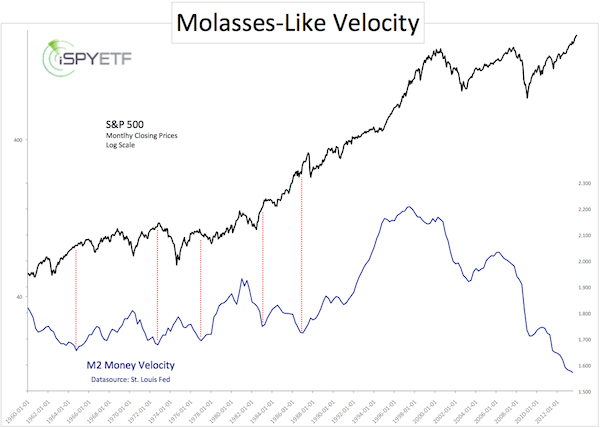
The S&P 500 is charted on a log scale to enhance the major up and downs of the past 55 years.
Low money velocity preceded a bear market in 1973 and lower prices in 1977. Low money velocity was also seen about a year before the 1987 crash, which sent the S&P 500 and Dow Jones spiraling.
But there were other instances that had no effect, or no immediate effect, on the S&P 500 (NYSEArca: SPY) and Dow Jones (NYSEArca: DIA).
The current wave of velocity anemia is as unprecedented as the Fed’s liquidity machinations. Both events are likely connected (for every action there’s a reaction).
At very best, money velocity (and lack thereof) may serve as a very blunt warning signal.
Fortunately, there are better warning signals. One of them is discussed here. In fact, it is so effective, I call it insider trading. How Insider Trading Just Became Legal
Simon Maierhofer is the publisher of the Profit Radar Report. The Profit Radar Report presents complex market analysis (stocks, gold, silver, euro and bonds) in an easy format. Technical analysis, sentiment indicators, seasonal patterns and common sense are all wrapped up into two or more easy-to-read weekly updates. All Profit Radar Report recommendations resulted in a 59.51% net gain in 2013.
Follow Simon on Twitter @ iSPYETF or sign up for the FREE iSPYETF Newsletter to get actionable ETF trade ideas delivered for free.

|
