Conspiracy theories are fun, but unfortunately they are often just that – theories – grown on the fertile soil of biased bloggers, journalists, or conspiracy groups.
Here’s a super enlightening piece of research published right on the website of the Federal Reserve Bank of New York. It comes straight from the horses mouth so to speak and tackles a very controversial subject.
The Fed – Stuck with the Hot Potato
The research talks about the equity premium. The equity premium is usually measured as the difference between the average return of the stock market (NYSEArca: VTI) and the yield on short-term government bonds (NYSEArca: SHY).
Analysts agree that the return of stocks should be greater than that of bonds to compensate for the volatility of stocks.
However, analysts can’t agree on the reason why the return of stocks is greater than that of short-term government bonds and what the return margin between stocks and government bonds should be to compensate for the extra risk linked to owning stocks.
This disagreement has given birth to the term “equity premium puzzle.”
David Lucca and Emanuel Moench (research posted on the New York Fed’s website) prove that: “80 percent of the equity premium on U.S. stocks has been earned over the twenty-four hours preceding scheduled Federal Open Market Committee (FOMC) announcements.” The researchers call this phenomenon a “drift.”
More than just a Drift
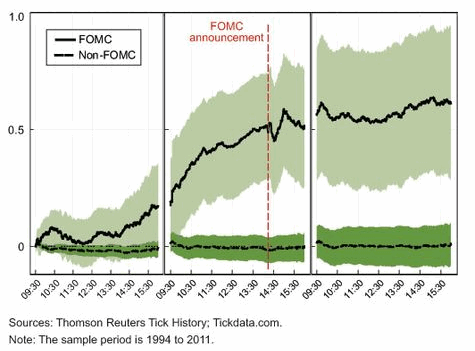
The pre-FOMC announcement drift is best summarized by the chart below, which provides two main takeaways:
-
Since 1994, there has been a large and statistically significant excess return on equities on days of scheduled FOMC announcements.
-
This return is earned ahead of the announcement, so it is not related to the immediate realization of monetary policy actions.
The chart shows average cumulative returns on the S&P 500 (SNP: ^GSPC) over different three-day windows.

The solid black line (the chart is not as clear as it should be, but it’s taken directly from Lucca and Moench’s research) displays the average cumulative return starting at the market’s opening on the day before each scheduled FOMC announcement to the market’s close on the day after each announcement.
The dashed black line (at the bottom), which represents the average cumulative return over all other three-day windows, shows that returns hover around zero.
This implies that since 1994, returns are essentially flat if the three-day windows around scheduled FOMC announcement days are excluded. What does that mean?
The 55% FOMC Overvaluation
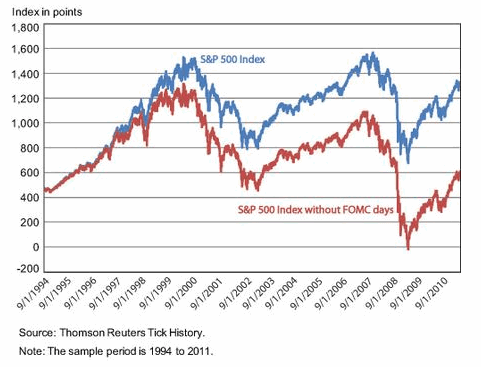
Let’s take a look at another chart to visualize the effect of the pre-FOMC announcement spike.
The chart below shows the S&P 500 (NYSEArca: SPY) in blue and red. The blue line is the actual S&P 500 performance, the red line (that’s where it gets interesting) is where the S&P 500 would be if you exclude the returns on all 2 pm – 2 pm windows ahead of the FOMC announcement.

Excluding those returns the S&P 500 would trade around 600, 55% below current prices.
Surprising Conclusion
The conclusion - after seeing the evidence Lucca and Moench have kindly provided – seems pretty obvious. But perhaps more surprising than the actual research itself is the ending statement of Lucca and Moench’s analysis: “The drift remains a puzzle.”
The above Federal Reserve study is in direct conflict with a recent study, also published by the Federal Reserve. The more recent Fed study basically claims that QE has no effect on the economy. It appears that the purpose of the study is to reflect any responsibility for a market crash. The details are available here: Surprising New Fed Study - Is it Preparing Americans for a Market Crash?
Simon Maierhofer is the publisher of the Profit Radar Report. The Profit Radar Report uses technical analysis, dozens of investor sentiment gauges, seasonal patterns and a healthy portion of common sense to spot low-risk, high probability trades (see track record below).
Follow Simon on Twitter @ iSPYETF or sign up for the iSPYETF Newsletter to get actionable ETF trade ideas delivered for free.

|