Here’s one example of how a different spin on a popular indicator can boost its meaning.
Investors Intelligence (II) reported that the percentage of bullish investors dropped to 41.8%.
At first glance this is a lukewarm reading, not too hot and not too cold. However, a closer look adds an intriguing layer of information.
The first chart plots the S&P 500 against the ‘plain’ percentage of bullish investment advisors.
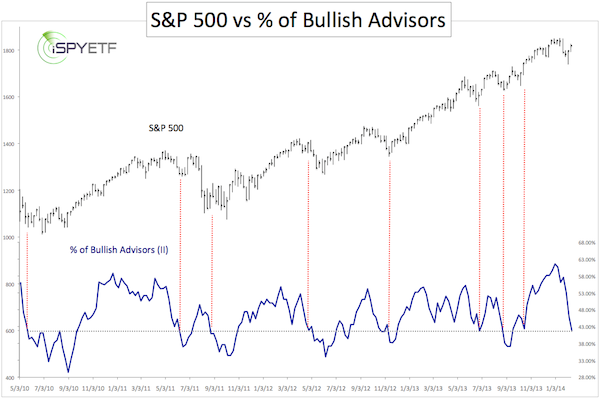
The gray line marks the 41.8% level. The red lines highlight what happens every time the percentage of bullish advisors drops to about 41.8.
Six out of eight times it marked a low, but four out of eight saw a lower low not long thereafter.
We can see that the quick turnaround in bullishness has some significance.
But how can we quantify this most recent cooling of investor sentiment (from 61.6% bullish advisors to 41.8%) and compare it to past precedents?
The second chart calculates the percentage change of bullish advisors from significant high to low and low to high, and overlays it against the S&P 500 (SNP: ^GSPC).
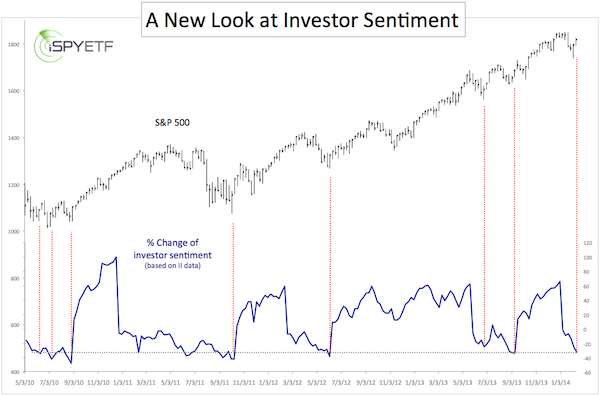
For example, the drop from 61.6% bulls on December 31, 2013 to 41.8% on February 12 translates into a 32.14% change.
The gray and red lines indicate that a 35% +/- drop in bullishness generally buoys the S&P 500 and S&P 500 ETF (NYSEArca: SPY).
The second chart tells us that, based solely on II sentiment, the rather shallow 6.3% correction for the S&P 500 may have been enough to relieve the overbought condition present at the beginning of the year.
Exclusively based on the chart, one could argue that this is a big fat buy signal.
However, sentiment is not the only component to ascertaining the market’s correction (I personally don't trust this signal yet).
There are other forces that suggest at least another leg down. One of them could be considered the oddball of technical analysis, but it correctly predicted the rally from 1,738 to 1,832 for the S&P 500.
Here’s a detailed look at this odd, but lately accurate indicator:
Stock Market is Fragmented and Confused – Message of One Oddball Indicator
Simon Maierhofer is the publisher of the Profit Radar Report. The Profit Radar Report presents complex market analysis (S&P 500, Dow Jones, gold, silver, euro and bonds) in an easy format. Technical analysis, sentiment indicators, seasonal patterns and common sense are all wrapped up into two or more easy-to-read weekly updates. All Profit Radar Report recommendations resulted in a 59.51% net gain in 2013.
Follow Simon on Twitter @ iSPYETF or sign up for the FREE iSPYETF Newsletter to get actionable ETF trade ideas delivered for free.

|
