Since September 2014, the Nasdaq Composite suffered seven false. This is the most ever.
A false breakout, or fake out breakout, is a break above prior highs followed by drop back below (red ovals).
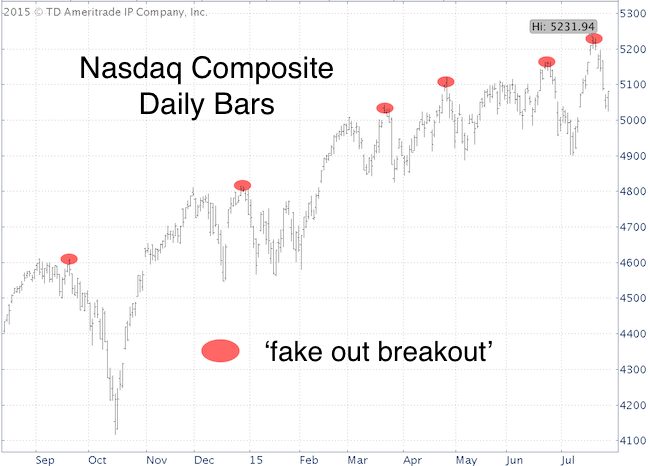
Obviously, if you are an investor who buys the breakout, the Nasdaq’s recent habit is quite annoying.
The Nasdaq Composite consists of all stocks traded on the Nasdaq (about 3,000), but there is no Nasdaq Composite ETF.
The PowerShares QQQ ETF (Nasdaq: QQQ) is based on the Nasdaq-100 (100 of the largest domestic and international nonfinancial companies listed on the Nasdaq).
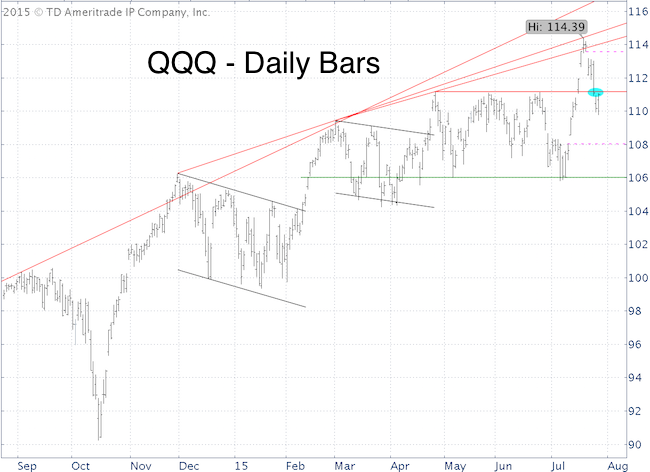
The July 19 Profit Radar Report warned against a false breakout, when it cautioned that: “Despite Friday’s strong QQQ performance, the majority of QQQ component stocks closed the day in the red. QQQ sports two big up side gaps, is overbought based on 2-day RSI, and is near a cluster of trend line resistance levels.”
If you enjoy quality, hand-crafted research, >> Sign up for the FREE iSPYETF Newsletter
Subsequently, the QQQ ETF dropped below support, and is now trying to get back above prior support (now resistance).
Historically, clusters of fake out breakouts are not necessarily bearish.
A bigger and better reason for caution is lagging breadth.
There are open chart gaps at 114.20 and 108.50.
Odds are that both gaps will get filled, the question is in which order. More chopping action may be ahead.
The S&P 500 chart offers a bit more clarity than the QQQ chart right now. Here's the S&P 500 forecast.
Simon Maierhofer is the publisher of the Profit Radar Report. The Profit Radar Report presents complex market analysis (S&P 500, Dow Jones, gold, silver, euro and bonds) in an easy format. Technical analysis, sentiment indicators, seasonal patterns and common sense are all wrapped up into two or more easy-to-read weekly updates. All Profit Radar Report recommendations resulted in a 59.51% net gain in 2013 and 17.59% in 2014.
Follow Simon on Twitter @ iSPYETF or sign up for the FREE iSPYETF Newsletter to get actionable ETF trade ideas delivered for free.

If you enjoy quality, hand-crafted research, >> Sign up for the FREE iSPYETF Newsletter
|
