Right now the Nasdaq-100 (Nasdaq: ^IXIC) is better suited for technical analysis than almost any other broad market index.
That’s a bold statement, but there’s a good reason. Unlike the S&P 500 (SNP: ^GSPC), Dow Jones (DJI: ^DJI) and many other indexes, the Nasdaq-100 is well below its all-time high.
Any index, stock or ETF at or near an all-time high has little up side resistance. Theoretically, the sky is the limit. Not so for the Nasdaq-100.
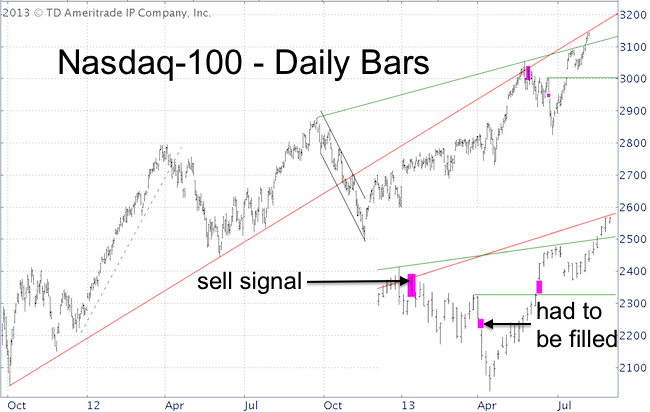
The chart below shows just two trend lines that have capped all of the Nasdaq’s recent advances and offered a number of great trade setups (more below).
Right now the Nasdaq is butting up against red trend line resistance. The up side is obviously limited as long as prices stay below the red trend line.
Going short against the red trend line would be a low-risk trade setup simply because the risk is limited and well defined. However, I’m not inclined to short this market (yet).
Even if the Nasdaq-100 (Nasdaq: QQQ) moves above the red trend line, it is very close to massive resistance going back to its all-time high in 2000. The resistance is massive, because it’s made up of two separate Fibonacci levels converging in close proximity of each other (more below).
Support is provided by the green trend line. As long as prices remain above the green trend line, the trend is up.
The Profit Radar Report has been taking advantage of those two trend lines for months. When the Nasdaq hit the red trend line the first time we covered our long positions. When the Nasdaq double backed the red trend line on May 28 (pink bar), the Profit Radar Report recommended to go short.
Such re-test of previously broken resistance is a bearish opportunity 8 out of 10 times.
The open chart gap left on June 20 was a clear signal that the index will come back up to fill this gap (short positions were covered shortly after the gap). Chart gaps act like magnets for price.
There’s an open chart gap just above 3,000. It too will be closed.
From Small to Big Picture
The red and green trend lines are ‘small fish’ compared to the truly massive resistance not far above current trade.
How the Nasdaq reacts at this key inflection point may well set the stage for the next year of trading. We’ll have to see what happens, but I believe the odds of a major top occurring against this massive resistance are greater than 50%.
The Profit Radar Report has revealed the key resistance level and how to trade the coming weeks.
|