Here’s a look at Wall Street’s moneymaking recipe box. Always delicious (except for this week), the yen carry trade feast.
The traditional yen carry trade is an interest rate play, where investors borrow yen and buy higher interest vehicles (which used to be U.S. Treasuries).
But, interest rates around the globe are close to zero, so there’s no margin.
The traditional yen carry has lost its spice. Here’s the new and improved recipe:
-
Borrow yen
-
Buy U.S. stocks
-
Enjoy tasty profits (falling yen, rising stocks)
-
Rinse and repeat …
The chart below shows the close correlation between the S&P 500 (SNP: ^GSPC) and the USD/JPY, which measures the value of the U.S. dollar in yen.
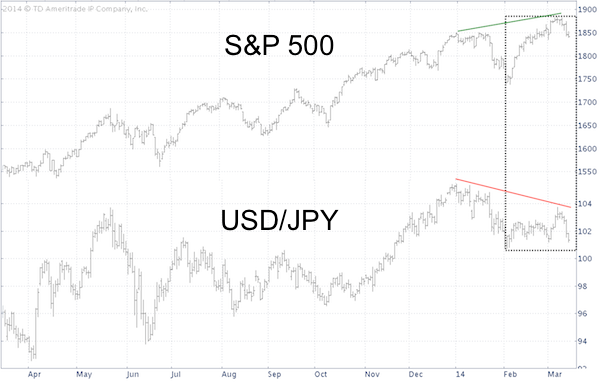
A falling yen and rising U.S. stocks turn both components of the carry trade (basically short the yen and long U.S. stocks) profitable.
But there are always two sides to a trade, and a rising yen (= falling USD/JPY pair) translates into double whammy losses.
That’s exactly what happened this week.
In other words, just as using sugar instead of salt screws botches a recipe, a rising yen (instead of a falling yen) turns Wall Street’s tasty profit formula into a bitter pill to swallow.
Due to the close S&P 500 / USD/JPY correlation, USD/JPY can be used as a leading indicator for the S&P 500 (NYSEArca: SPY).
What’s USD/JPY telling us about the S&P?
The Profit Radar Report featured the chart below in the March 12 update and made the following comment:
“A rising yen (falling USD/JPY) would stifle this particular carry trade. The chart below shows that USD/JPY hasn’t been able to move above resistance at 103.70. The USD/JPY staying below 103.70 is one of the few clues that suggests stocks may actually move lower.”
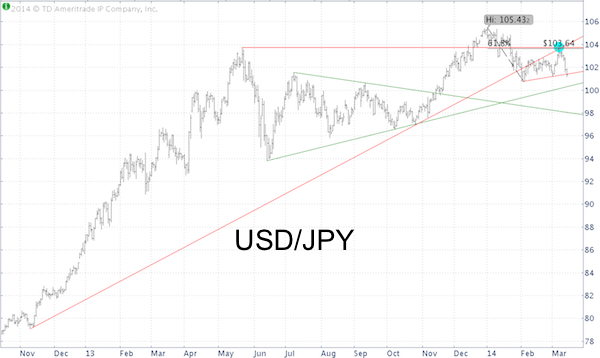
Resistance at 103.70 is important, because it’s made up of three separate resistance levels meeting at the same spot:
-
The ascending red trend line
-
The May 2013 high
-
61.8% Fibonacci retracement of the points lost from January 2 to February 3
As it turns out, this resistance cluster was too much, the USD/JPY pair succumbed to the pressure, dragging the S&P 500 down as well.
By Friday the USD/JPY pair closed even below a minor support shelf, suggesting more down side to come.
Where is next support and could the unraveling of the carry trade turn into a bigger correction for U.S. stocks?
A detailed forecast for the S&P 500 is available via the Profit Radar Report.
The USD/JPY pair wasn’t the only factor that warned of impending down side.
Perhaps the most popular technical indicator known to Wall Street suggested the same thing, but surprisingly nobody picked up on it. More details here:
The Biggest S&P 500 Dilemma Explained in One Chart
Simon Maierhofer is the publisher of the Profit Radar Report. The Profit Radar Report presents complex market analysis (S&P 500, Dow Jones, gold, silver, euro and bonds) in an easy format. Technical analysis, sentiment indicators, seasonal patterns and common sense are all wrapped up into two or more easy-to-read weekly updates. All Profit Radar Report recommendations resulted in a 59.51% net gain in 2013.
Follow Simon on Twitter @ iSPYETF or sign up for the FREE iSPYETF Newsletter to get actionable ETF trade ideas delivered for free.

|
