Bill Gross just wrote that the bull market supercycle for stocks and bonds is approaching an end. Gross has made similar warnings before and acknowledges they were premature.
Eventually Mr. Gross will be right, but when?
Here are two indicators that have kept us on the right side of the trade for years.
The chart below plots the S&P 500 against the percentage of NYSE stocks above their 50-day SMA, and a liquidity gauge I call 'secret sauce' (actual name available to subscribers of the Profit Radar Report).
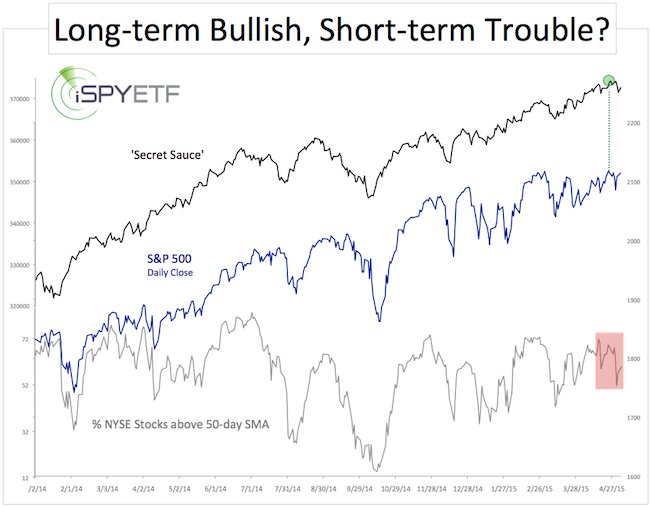
‘Secret sauce’ is an incredibly reliable long-term major market top indicator. It essentially measures liquidity and demand. All recent major market tops (1987, 2000, 2007) were foreshadowed by a down turn in the ‘secret sauce’ indicator. Throughout 2010, 2011, 2012, 2013, 2014 and 2015, 'secret sauce' has been pointing higher.
On average, ‘secret sauce’ starts turning south about six months before the final S&P 500 high. The recent S&P 500 (NYSEArca: SPY) high was confirmed by ‘secret sauce,’ so the final top still seems months away (more details about ‘secret sauce’ is available here: Is the S&P 500 Carving Out a Major Market Top?).
The percentage of NYSE stocks above their 50-day SMA is a shorter-term measure of market breadth.
Although the S&P 500 settled within 0.2% of its all-time closing high yesterday, there were only 59.8% of NYSE stocks above their 50-day SMA, compared to 71.7% on April 15.
Never Miss a Beat! >> Sign up for the FREE iSPYETF e-Newsletter
This condition of internal weakness doesn’t prevent further gains – in fact I’d love to see another flameout spike - it suggests that this rally is becoming more selective and susceptible to a pullback or larger correction.
Based on this set of indicators - which I consider quite reliable – there should be a correction followed by another rally to new highs.
Continuous updates will be available via the Profit Radar Report.
Simon Maierhofer is the publisher of the Profit Radar Report. The Profit Radar Report presents complex market analysis (S&P 500, Dow Jones, gold, silver, euro and bonds) in an easy format. Technical analysis, sentiment indicators, seasonal patterns and common sense are all wrapped up into two or more easy-to-read weekly updates. All Profit Radar Report recommendations resulted in a 59.51% net gain in 2013 and 17.59% in 2014.
Follow Simon on Twitter @ iSPYETF or sign up for the FREE iSPYETF Newsletter to get actionable ETF trade ideas delivered for free.

Never Miss a Beat! >> Sign up for the FREE iSPYETF e-Newsletter
|
