This indicator is so valuable, I don’t want to keep it to myself. Unfortunately, I’m a bit in a pickle though.
I want to be fair to my subscribers. It just wouldn’t be right to share research reserved for paying subscribers for free, so I came up with this compromise:
You will see the indicator in its full power and glory, but I won’t disclose its name. It will simply be dubbed ‘secret sauce.’
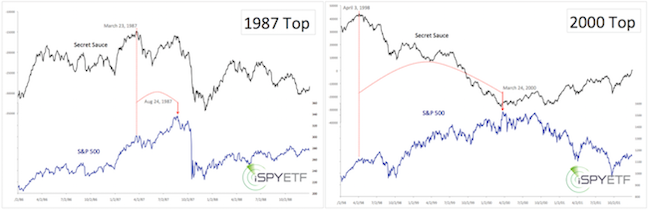
As the charts below will show, ‘secret sauce’ correctly telegraphed the 1987, 2000 and 2007 market crashes.
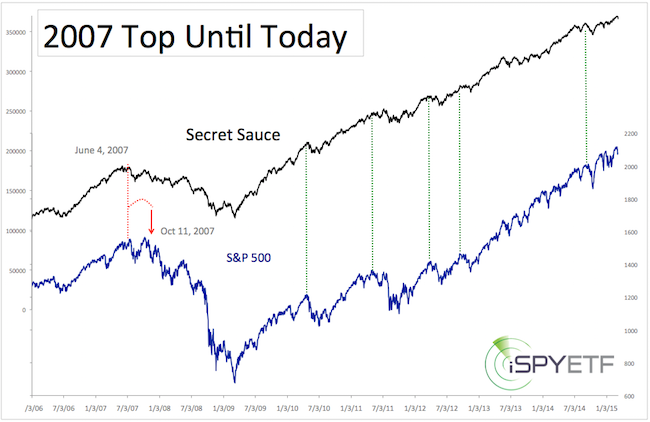
Perhaps even more importantly, ‘secret sauce’ told investors to stay invested throughout this 6-year old bull market. Although there’ve been corrections along the way, ‘secret sauce’ has consistently pointed to new (all-time) highs.
What is Secret Sauce?
‘Secret sauce’ is basically a market breadth and liquidity indicator. Here’s how it works:
You know something’s wrong if the S&P 500 is at new highs, but ‘secret sauce’ isn’t.
If you enjoy quality, hand-crafted research, >> Sign up for the FREE iSPYETF Newsletter
That’s what happened prior to the 1987, 2000 and 2007 crashes. ‘Secret sauce’ failed to confirm the new S&P 500 highs, which was an early indication of internal deterioration.
Like a ceiling fan that keeps going after it’s switched off, the market tends to keep going for a little while after liquidity and breadth peaks. ‘Secret sauce’ is a good reflection of when liquidity peaks and momentum slows before stocks roll over.
The first chart plots the 1987 and 2000 top against the S&P 500 (NYSEArca: SPY). The vertical red lines show the ‘incubation period’ between peak liquidity/breadth and peak price.
The second chart highlights the 2007 bearish divergence, which essentially marked the beginning of the end for stocks. It also captures the bullish green confirmations that kept pointing to continual new highs following the 2009 low.
I stumbled upon ‘secret sauce’ in 2013, and first introduced it to subscribers in the December 1, 2013 Profit Radar Report. Ever since then we’ve known to expect higher prices.
Obviously ‘secret sauce’ isn’t a short-term timing tool, but knowing whether a correction will morph into a full-fledged bear market or not has been incredibly helpful.
Especially since the media and self-proclaimed market pros have been calling for a market crash for years.
-
December 30, 2013: Why the market could see a 17% drop in 2014 – CNBC
-
May 15, 2014: Stocks are telling you a bear market is coming – MarketWatch
Imagine knowing when to simply ignore headlines as baseless fear-mongering. Is the recent pullback the beginning of the end?
All the details about ‘secret sauce’ (and continued updates) are available via the Profit Radar Report.
Simon Maierhofer is the publisher of the Profit Radar Report. The Profit Radar Report presents complex market analysis (S&P 500, Dow Jones, gold, silver, euro and bonds) in an easy format. Technical analysis, sentiment indicators, seasonal patterns and common sense are all wrapped up into two or more easy-to-read weekly updates. All Profit Radar Report recommendations resulted in a 59.51% net gain in 2013 and 17.59% in 2014.
Follow Simon on Twitter @ iSPYETF or sign up for the FREE iSPYETF Newsletter to get actionable ETF trade ideas delivered for free.

|
