45% of airplane accidents occur during takeoff or landing. Why?
That’s when the airplane is in closer proximity to the ground, the speed is slower and more airplanes are in the immediate airspace.
Similarly, most S&P 500 (SNP: ^GSPC) reversals (minor and major) occur at support or resistance levels. Why?
That’s when stocks are in close proximity to ‘supply and demand hubs,’ areas prone to additional buying or selling pressure.
The S&P 500 is about to hit such a ‘supply/demand hub’ or resistance level.
The S&P 500 chart below shows a trend channel that has contained prices for 28 months.
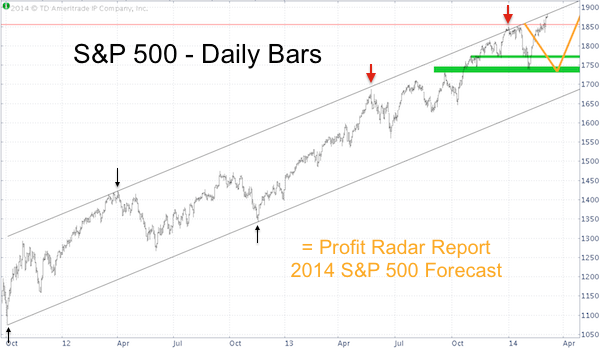
The black arrows mark the anchor points of this channel. The red arrows highlight prior meetings of this channel.
The two biggest corrections (if you can call them big) of the last year occurred in May 2013 and January 2014 right after meeting (or nearly meeting) the upper channel line.
In late December 2013, the S&P exceeded the channel by ten points and closed above it for four days, so we need to allow some wiggle room. The channel is at S&P 1,883 today and ascends about 0.75 points per day. Round number resistance is around S&P 1,900.
The yellow line is the ideal S&P 500’s path outlined by the Profit Radar Report’s 2014 S&P 500 Forecast (published on January 15, full 2014 Forecast available to subscribers).
Although the timing wasn’t perfect, in terms of form the forecast is on track.
A longer-term S&P 500 (NYSEArca: SPY) analysis independent of this particular channel suggests that the S&P 500 rally is not yet over.
In fact, unbelievably though, it is even possible that the rally may accelerate. Another option sees a shakeout correction followed by a resumption of the rally.
The ‘supply/demand hub’ (and stocks’ reaction to the hub) around trend channel resistance should provide further clues about the next move.
A detailed projection of the two near-term scenarios along with the full 2014 Forecast is available via the Profit Radar Report.
Simon Maierhofer is the publisher of the Profit Radar Report. The Profit Radar Report presents complex market analysis (S&P 500, Dow Jones, gold, silver, euro and bonds) in an easy format. Technical analysis, sentiment indicators, seasonal patterns and common sense are all wrapped up into two or more easy-to-read weekly updates. All Profit Radar Report recommendations resulted in a 59.51% net gain in 2013.
Follow Simon on Twitter @ iSPYETF or sign up for the FREE iSPYETF Newsletter to get actionable ETF trade ideas delivered for free.

|
