The QE bull market is 53 months old. The S&P 500 (SNP: ^GSPC) trades 156% higher today than at its March 2009 low, the Nasdaq-100 (Nasdaq: ^IXIC) and Russell 2000 (Chicago Options: ^RUT) are up 209%.
No one else in the mainstream media is calling for a top, which is all the more reason to open this particular can of worms: Is a market top near?
One specific segment of traders has offered valuable clues about approaching market tops in the past: Option traders.
Equity Put/Call Ratio
The Equity Put/Call Ratio and SKEW Index capture the actions of the kind of option traders considered ‘dumb money’ (please don’t shoot the messenger, I didn’t come up with the term).
The Equity Put/Call Ratio shows the put volume relative to call volume. A ratio above 1 occurs when put volume exceeds call volume. The ratio is below 1 when call volume exceeds put volume.
Puts are bought to protect portfolios against declines; calls are bought as a bet on higher prices.
Since this is a contrarian indicator, high readings (0.9 or above) are usually seen near market bottoms when fear of a decline runs high. Readings around or below 0.5 reflect a dangerous extent of complacency and occur near market highs.
Last week the Put/Call Ratio fell as low as 0.55%. What does that mean?
The chart below plots the S&P 500 (NYSEArca: SPY) against the equity Put/Call Ratio (bottom of chart) and the SKEW Index (more about the SKEW in a moment).
The vertical red lines highlight readings at market tops.
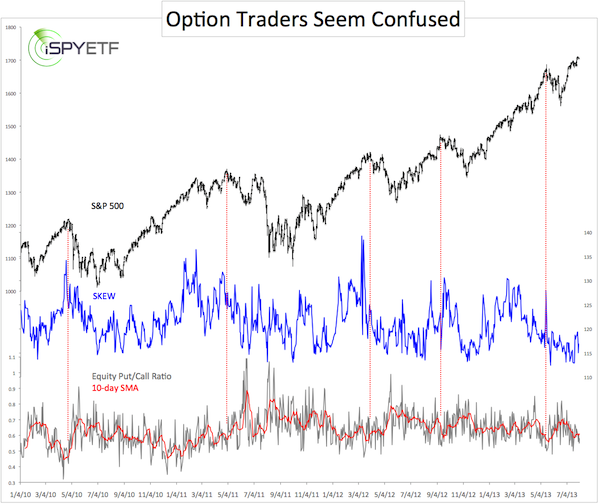
When viewed in the context, the current Equity Put/Call Ratio is approaching a level that’s caused trouble for stocks in the past.
This note, which I sent to subscribers on April 16, 2010 explains exactly why: “The put/call ratio can have far reaching consequences. Protective put-buying provides a safety net for investors. If prices fall, the value of put options increases balancing any losses accrued by the portfolio. Put-protected positions do not have to be sold to curb losses. At current levels however, it seems that only a minority of equity positions are equipped with a put safety net. Once prices do fall and investors do get afraid of incurring losses, the only option is to sell. Selling results in more selling. This negative feedback loop usually results in rapidly falling prices.”
This note preceded the 2010 ‘Flash Crash’ by only 13 days.
The current reading doesn’t foreshadow a Flash Crash, but a degree of caution is warranted.
SKEW Index
Like the VIX (Chicago Options: ^VIX), the SKEW is calculated by the CBOE. The SKEW is far less popular than the VIX, but has delivered much better signals than the VIX lately.
The SKEW in essence estimates the probability of a large decline. Readings of 135 suggest a 12% chance of a decline. Readings of 115 suggest a 6% chance of a large decline (large decline is defined as a two standard deviation move).
In other words, low extremes are bullish for stocks; high extremes are bearish for stocks.
As the chart shows, the SKEW is currently in ‘bullish for stocks’ territory.
This contradicts the more or less bearish message of the Equity Put/Call Ratio.
What do we make of this?
Past experience has taught me not to bet against the SKEW. It’s prudent to allow for higher prices, perhaps after a shallow correction.
To get the best possible read on the stock market, I look at sentiment (such as options data and other sentiment/money flow gauges, seasonality and technical signals.
Right now the technical picture for the Nasdaq-100 (Nasdaq: QQQ) is fairly crisp and clear. The Nasdaq-100 is moving towards serious resistance in a well-defined trend line channel. This resistance increases the odds of a sizeable top dramatically.
Simon Maierhofer is the publisher of the Profit Radar Report.
|
