The March 6, iSPYETF article on ‘Gold vs GDX’ mercilessly ousted the fundamental profit making flaws of the gold mining sector.
To say that gold mining stocks have had a hard time monetizing their mining activity in an environment of falling gold prices is like claiming hurricane Sandy was just a stiff breeze.
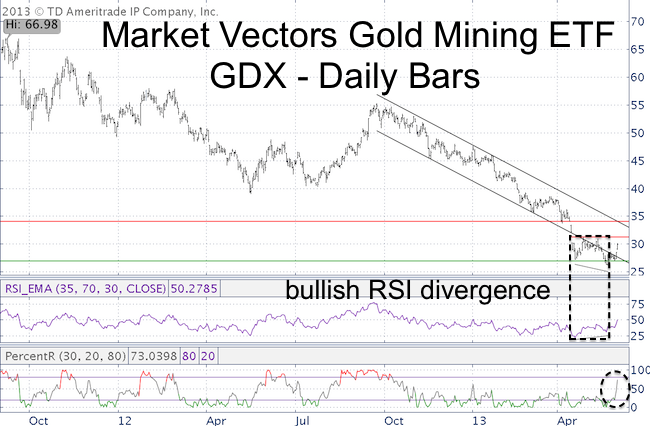
The Market Vectors Gold Miners ETF (GDX) lost 60.8% from top to bottom tick, but if there’s anything we’ve learned from QE is that what comes down likely goes back up.
Based solely on technical analysis, GDX just completed the first steps of a bullish breakout.
The May 20 low has three trademarks of a tradable bottom.
-
It sports a bullish RSI divergence where price dropped to a new low, but RSI did not.
-
Prices were able to close above the black parallel channel that confined much of the previous down trend.
-
Thursday’s pop canceled a bearish percentR low-risk entry. percentR (or Williams %R) is a momentum indicator. According to my personal methodology (which is correct about 60 – 70% of the time) the immediate down trend is now broken.
It obviously will take more confirmation for the fledgling breakout to ‘stick,’ but the above-mentioned bullish factors decrease the odds of being cut by trying to catch a falling knife.
A close above the first red resistance line at 31.27 will be further confirmation that a tradeable low is in while key support is located right around 27. Use illustrated support/resistance levels to spot low-risk entries.
Low-risk entries are not no-risk entries. But going long against support, or once resistance is broken (and then used as support and foundation for a stop-loss level), significantly limits your risk and lets you know exactly when you’re wrong.
Currently prices are 5%+ away from support or resistance. Using support at 27 as stop-loss, the risk (drop from 29.40 to 27) is 8.2%. It makes sense for prices to pull back or resistance to be taken out for a lower risk entry.
The Profit Radar Report specializes in pinpointing low-risk entries for the S&P 500, Nasdaq-100, euro, dollar, gold, silver and 30-year Treasuries. There’s always an opportunity somewhere, and the Profit Radar Report helps you find it.
|
