On February 14, I wrote about a ‘big fat’ buy signal (New Spin on Old Indicator Gives Big Fat Buy Signal).
Now this ‘big fat’ buy signal is met by an indicator that suggests elevated risk of a serious decline (‘Black Swan’ event).
Which indicator measures the odds of a ‘Black Swan’ event?
It’s the CBOE SKEW Index.
The SKEW Index is calculated by the CBOE. The CBOE is also responsible for the VIX (NYSEArca: VXX).
According to CBOE, the SKEW is designed to measure the tail risk (= risk of outlier returns two or more standard deviations below the mean) of the S&P 500.
The SKEW Index basically estimates the probability of a large decline or ‘Black Swan’ event.
Similar to the CBOE VIX or VIX Volatility Index (Chicago Options: ^VIX), the price of the S&P 500 tail risk is calculated from the price of the S&P 500 out-of-the-money options.
The SKEW typically ranges from 115 to 135. Readings of 135+ suggest a 12% chance of a large decline (2 standard deviations). Readings of 115 or less suggest a 6% chance of a large decline.
The chart below shows the SKEW readings since January 2012 and plots them against the S&P 500 (SNP: ^GSPC).
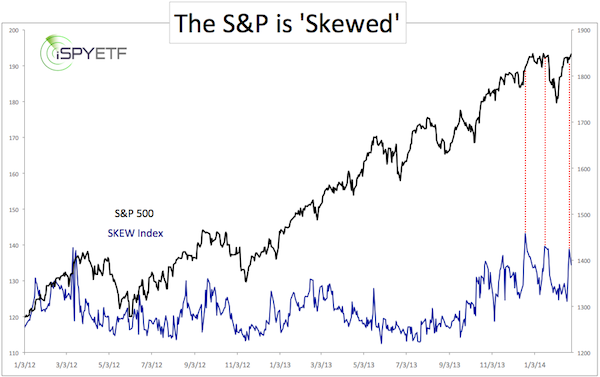
On Friday the SKEW jumped to 138.79. This isn’t the top tick (December/January saw 139.62 and 143.20), but it’s higher than 99.5% of all other readings since January 2012.
The red lines highlight that elevated SKEW readings (such as 138+) translate into limited up side potential and increased down side risk.
The SKEW is very helpful, but should be combined with other facets and forward-looking analysis.
The December 20, 2013 Profit Radar Report (Sentiment Picture) put the message of the SKEW in context with other indicators and forecasted the following:
“Bullish sentiment will catch up with stocks in January. This should cause a deeper, but also temporary correction.”
The S&P 500 and S&P 500 ETF (NYSEArca: SPY) saw a ‘deeper but temporary’ correction and price and SKEW are basically back to where they were in January.
More up side is possible as long as the S&P 500 can stay above support, but the SKEW suggests that the up side is limited and any gains to be erased eventually.
A unique analysis of another popular indicator cautions that the SKEW's message may be valid:
MACD Did Not Yet Confirm Stocks Up Trend
Simon Maierhofer is the publisher of the Profit Radar Report. The Profit Radar Report presents complex market analysis (S&P 500, Dow Jones, gold, silver, euro and bonds) in an easy format. Technical analysis, sentiment indicators, seasonal patterns and common sense are all wrapped up into two or more easy-to-read weekly updates. All Profit Radar Report recommendations resulted in a 59.51% net gain in 2013.
Follow Simon on Twitter @ iSPYETF or sign up for the FREE iSPYETF Newsletter to get actionable ETF trade ideas delivered for free.

|
