Every last Tuesday of the month Standard & Poor’s releases the latest S&P/Case-Shiller Home Price Index figures.
The S&P/Case-Shiller Home Price Index uses a 3-month average and is published with a 2-month lag, so the data we got today is actually the June data.
In the truest sense of the word, the S&P/Case-Shiller Home Price Index is a lagging indicator.
This doesn’t mean it’s without value. It is a great gauge of past real estate activity. Not future and not even present.
The chart below shows the S&P/Case-Shiller 20-City Composite Home Price Index from January 2000 – June 2013.
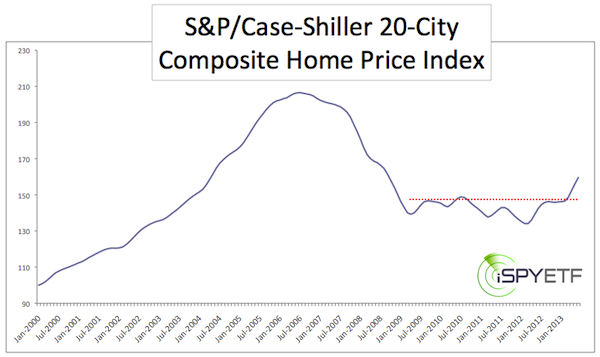
When put on paper, the much applauded real estate recovery is a bit less spectacular than various media reports and the performance of the SPDR S&P Homebuilders ETF (NYSEArca: XHB), iShares Dow Jones US Real Estate ETF (NYSEArca: IYR), or Vanguard REIT ETF (NYSEArca: VNQ) lead us to believe.
XHB is up 250%, IYR is up 186%, and VNQ is up 217% since its 2009 low.
The S&P/Case-Shiller Home Price Index sports a modest 12% gain from the April 2009 low at 136 to the last reading. It seems like QE is more effective for stocks than brick and mortar real estate.
But regardless of strong or negligible gains, the focus of this article was to enhance the ‘rear-view mirror’ message of the S&P/Case-Shiller Home Price Index and come up with an actionable outlook for real estate prices.
From Lagging Index to Leading Indicator
Here’s how to turn the lagging S&P/Case-Shiller Home Price Index into a leading indicator:
1) Disregard the S&P/Case-Shiller Home Price Index.
2) Use lumber prices as a leading indicator.
For some reason there is a strong correlation between lumber prices and home prices. I don’t know why, but I suppose it has to do with the fact that lumber is an integral part of every house. There's even been a strong correlation between lumber prices and the S&P 500 (SNP: ^GSPC). Go here to view a chart comparison between the S&P 500 and lumber.
The lumber/housing interaction isn't strikingly obvious, because the housing sector tends to follow lumber prices with a 14-month lag, so we need to set forward lumber by 14-months.
The chart below does just that, as it plots the PHLX Housing Sector against lumber futures (set forward by 14-month).
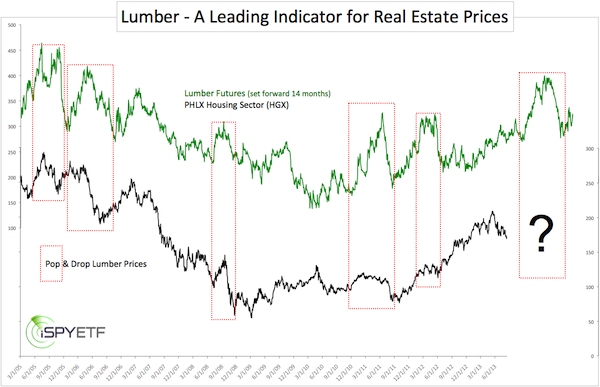
This chart doesn’t point out all the correlations between highs and lows, but if you are interested to see click here to view the lumber/real estate correlation.
The 33% drop of lumber prices from March – May 2013, after a serious rally, makes this correlation really intriguing.
The chart highlights similar prior ‘pop and drop’ scenarios and how real estate prices reacted. More often than not it wasn’t positive for real estate prices going forward.
The key questions here are:
1) How will the housing sector react to the steep lumber pop and drop?
2) What’s next for lumber prices?
A detailed analysis and forecast for lumber prices is available here: "Lumber Prices Foreshadow What's Next for Real Estate - and S&P 500?"
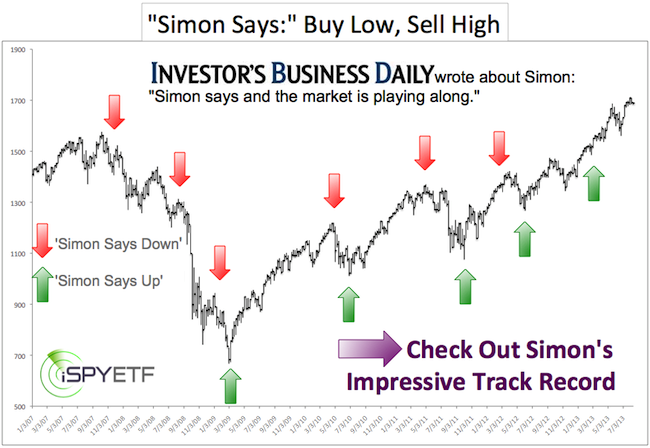
Simon Maierhofer is the publisher of the Profit Radar Report.
Follow him on Twitter @ iSPYETF or sign up for the FREE Newsletter.
|
