High probability setups are like gold nuggets: rare and precious.
What is a high probability setup?
A high probability setup is a buy (or sell) signal with a high probability of being profitable.
What makes it high probability?
Investing (or trading) is all about putting the odds in your favor. The stronger the signal, the better the odds.
The strongest signal is when all of the following indicators point in the same direction:
-
Supply and demand data (only available for stocks)
Our proprietary supply and demand research (supply and demand is the most powerful force of any market place) measures the actual buying or selling pressure behind the major stock indexes' moves, and discerns trends not visible via price charts.
Supply and demand data is very helpful when it comes to spotting major tops and bottoms. Major market tops tend to be preceded by increasing selling into rising prices. Major bottoms tend to be preceded by increasing buying activity despite falling prices.
-
Technical analysis
Technical analysis includes Fibonacci levels, trend lines, breadth and momentum indicators, support & resistance levels, bullish or bearish divergences, Elliott Wave Theory and more.
-
Sentiment
Sentiment research includes various money flow indicators, commitment of traders report, sentiment polls, media sentiment, investment managers polls and more.
-
Seasonality
Seasonality includes unique full-year seasonality charts, repeating seasonal patterns & anomalies, and long-term cycles.
No other signal is more powerful than a unified composite buy or sell signal by the above indicators.
Actual High Probability Signals
The last high probability S&P 500 signals we got (both buy) date back to October 2011 (S&P traded at 1,100) and June 2012 (S&P traded at 1,280).
There hasn't been a S&P signal since, but here is one recent signal we found elsewhere in the ETF universe.
I shared the following via the March 25 Profit Radar Report:
“The more research I do, the more attractive owning the Aussie dollar becomes. Seasonality is turning very bullish in April, cycles are up, sentiment is extreme, the latest low came with a bullish RSI divergence, and it broke above red trend line resistance.
There is no guarantee, but this is as close to a high probability trade as we've seen in quite a while. We want to own the Aussie dollar. Unfortunately currencies aren’t big movers, so the up side isn’t huge.”
Never Miss a Beat! >> Sign up for the FREE iSPYETF e-Newsletter
One way to gain exposure to the Australian dollar is via the CurrencyShares Australian Dollar ETF (NYSEArca: FXA).
Sentiment
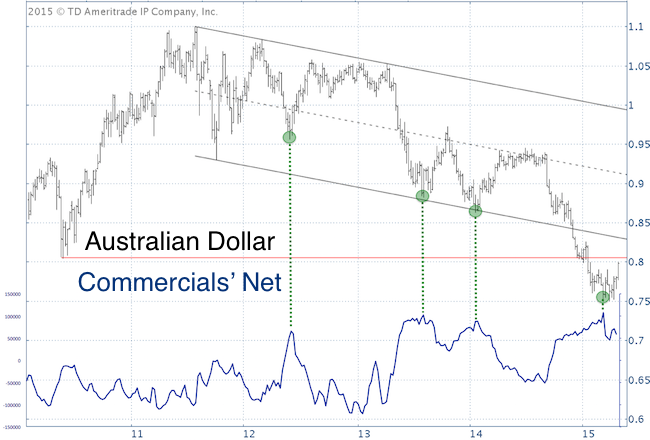
The first chart offers a long-term look at the Australian dollar and investor sentiment (commercial traders’ net futures position).
As the dashed green lines highlight, every time commercials’ net exposure soared, the Australian dollar started to rally.
Sentiment: Bullish
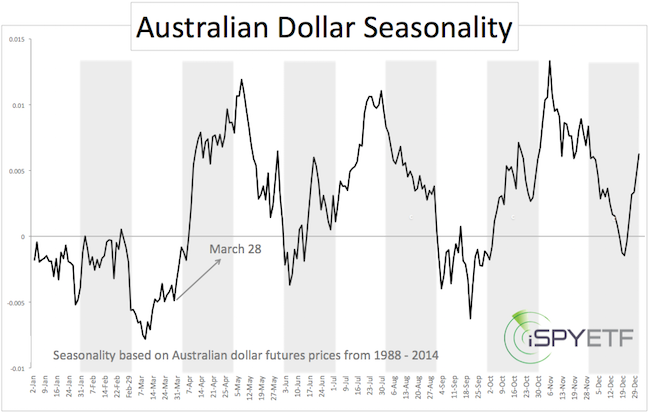
Seasonality
Seasonality projected a strong March – May rally. The Australian dollar seasonality chart is based on Australian dollar futures prices from 1988 – 2014.
The daily performance of each year is weighted equally and averaged to attain seasonality, which reflects the average performance of the Aussie dollar based on 26 years of price history.
Seasonality: Bullish
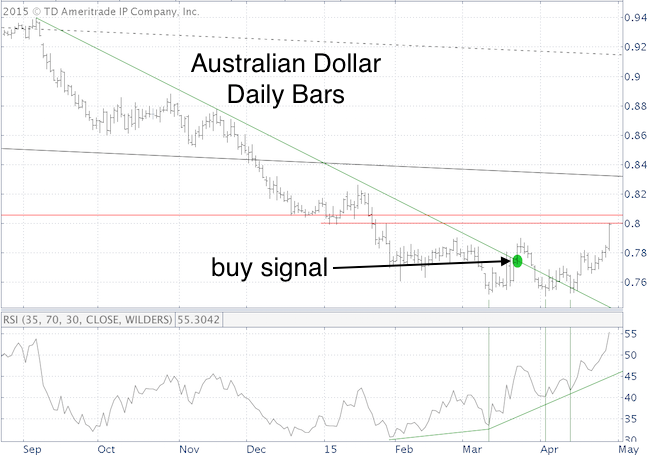
Technical Analysis
On March 23 (green dot) the Aussie dollar broke above trend line resistance. There was also a bullish RSI divergence at every low in March or April.
Technical analysis: Bullish
Benefit of High Probability Setups
The Australian dollar did not rally immediately after the March 25 buy signal. In fact, it dropped at first.
However, since seasonality and sentiment suggested higher prices, we stuck to our guns and held on.
High probability setups deserve a ‘longer leash,’ because more often than not, trade moves in the expected direction.
The Aussie dollar is up more than 3% since the buy signal, but has now reached long-term resistance and may pull back. Another stab higher is likely, but this high probability buy signal may soon have run its course.
Simon Maierhofer is the publisher of the Profit Radar Report. The Profit Radar Report presents complex market analysis (S&P 500, Dow Jones, gold, silver, euro and bonds) in an easy format. Technical analysis, sentiment indicators, seasonal patterns and common sense are all wrapped up into two or more easy-to-read weekly updates. All Profit Radar Report recommendations resulted in a 59.51% net gain in 2013 and 17.59% in 2014.
Follow Simon on Twitter @ iSPYETF or sign up for the FREE iSPYETF Newsletter to get actionable ETF trade ideas delivered for free.

Never Miss a Beat! >> Sign up for the FREE iSPYETF e-Newsletter
|
