A puppet master is a person, group or force that covertly controls a matter. Wielding this kind of covert power is also known as pulling the strings behind the scenes.
We know that the Federal Reserve is openly pulling strings, but that’s not what this article about.
It’s about a different kind of ‘force’ that drives the S&P 500. It doesn’t drive the S&P 500 every single day, but often enough to be considered a valid force.
To recognize, oust, and ultimately profit from this force, please join me in a little experiment.
Experiment: Stage 1 (do not peek)
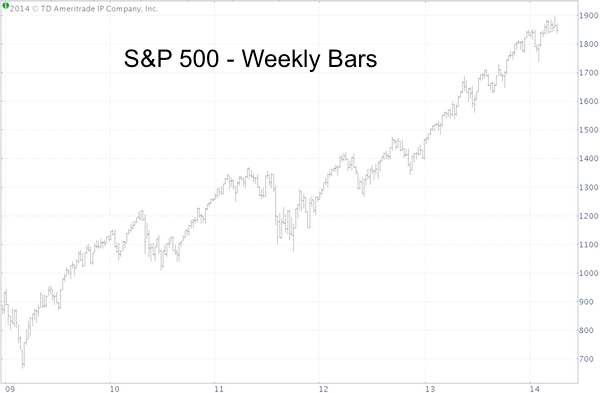
Below is a chart of the S&P 500 (SNP: ^GSPC). Please take a moment to look at the chart and see if you can observe certain patterns (do not peek ahead to the second chart).
Experiment: Stage 2
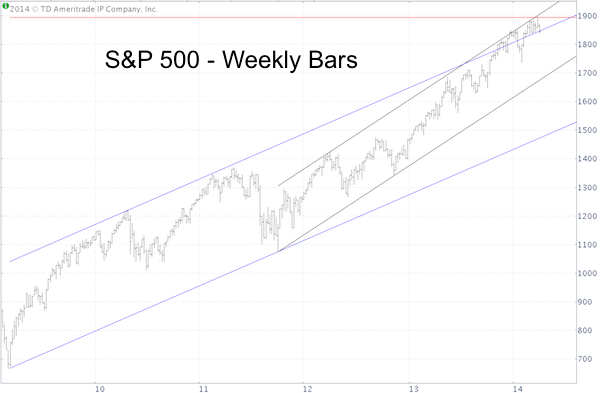
Below is the same chart with three very simple annotations.
-
A blue trend channel going back to the March 2009 low.
-
A black trend channel going back to the October 2011 low.
-
Fibonacci projection (red line) going back to the March 2009 low.
Please keep in mind that I didn’t create those lines. The market did. I only connected the dots (the Profit Radar Report has been monitoring these trend lines for many weeks).
Experiment: Stage 3
The third chart shows the same two channels and Fibonacci resistance, but shows daily bars to allow for a closer examination of the more recent price action.
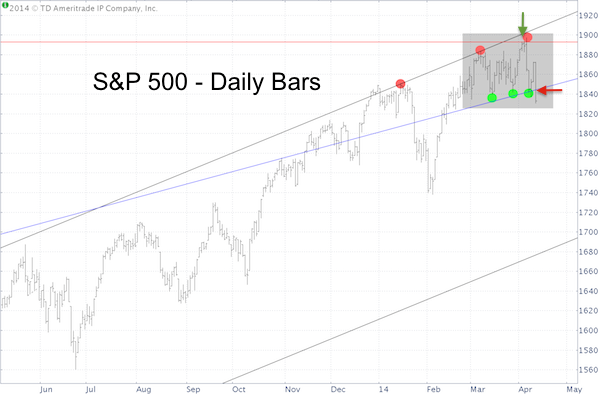
Here is what we see:
-
The S&P 500 was repelled by the black channel in January, March and April (red dots).
On April 2 (green arrow), the S&P 500 staged a technical breakout to new all-time highs, but the Profit Radar Report pointed out resistance at 1,898 (created by a short-term channel) and 1,900 and warned that this looked like a false breakout.
-
The S&P 500 found support around the blue channel three times in March and April (green dots).
-
The S&P 500 (NYSEArca: SPY) essentially treaded water in an expanding range wedge created by two powerful long-term trend channels.
-
Yesterday, the S&P 500 sliced below the blue channel. Support is like thin ice, if broken it gets investors wet. Trend lines like that make great guidelines for stop-loss levels.
Please Mock Me
Usually when I write articles about trend lines, readers post comments like this one:
“More BS from the techies. I can take any chart and draw these lines and call it a trend.”
Ironically, those kinds of comments are a good sign. A puppet master ousted as puppet master is no longer able to covertly influence others.
In order for trend lines to continue working, there need to be enough doubters, mockers, hecklers, and investors simply unaware of the power of this simple tool.
So please, go ahead and disregard trend channels and allow the rest of us to enjoy their full benefit.
Even before the channel was broken, a number of indicators suggested lower prices. The April 7 Profit Radar Report reported an MACD sell signal and bearish seasonality and concluded that:
“Today’s decline looks like an important building block for a multi-week bearish structure.”
We’ve all heard about MACD, but this particular MACD signal is especially unique and potent. The reason why it's discussed here:
MACD Triggers the Year’s Most Infamous Sell Signal
Simon Maierhofer is the publisher of the Profit Radar Report. The Profit Radar Report presents complex market analysis (S&P 500, Dow Jones, gold, silver, euro and bonds) in an easy format. Technical analysis, sentiment indicators, seasonal patterns and common sense are all wrapped up into two or more easy-to-read weekly updates. All Profit Radar Report recommendations resulted in a 59.51% net gain in 2013.
Follow Simon on Twitter @ iSPYETF or sign up for the FREE iSPYETF Newsletter to get actionable ETF trade ideas delivered for free.

|
