Did somebody upset the “Apple cart?” Apple's earnings disappointed and the stock closed lower 6 out of 8 trading days. How much lower can Apple fall?
For readers of iSPYETF Apple’s 17% drop doesn’t come as a surprise. This September 18 article posted on iSPYETF (Technology Investing for Beginners – You Can’t Lose Money with Apple Math) warned that:
“Common sense and seasonality suggests that Apple is soon due for a reality check (a. k. a. lower prices). Since Apple is the MVP of the technology sector, it’s likely that the Nasdaq QQQ ETF and SPDR Technology ETF (XLK) will follow Apple’s direction.”
The September 12, Profit Radar Report (which identifies profit opportunities for subscribers) issued this trading recommendation: “Thus far Apple has been able to close above support at 660, but RSI is deteriorating. Aggressive investors may short Apple (or buy puts or sell calls) above 700 or with a close below 660. Obviously, there is no short Apple ETF and if you don’t have a margin account set up, you may consider using the ShortQQQ ProShares (PSQ), which aims to deliver the inverse performance of the Nasdaq-100 (Apple accounts for 20% of the Nasdaq-100).”
How Low Can Apple Go?
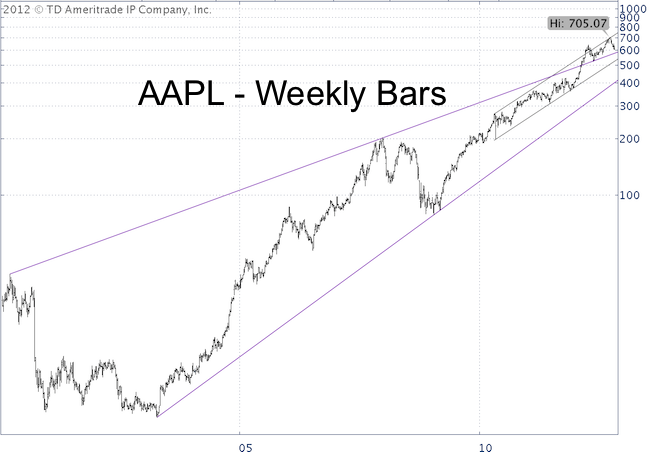
AAPL has rallied from $6 – $700 since 2003, so obviously there’s plenty of down side risk. The more appropriate question is: Where’s the next support for AAPL?
Below is an updated version of a chart that was first featured on this site on August 22 (Apple Bullies the Nasdaq and S&P 500 But May Soon Disappoint Investors).
We’re looking at a log scale chart of AAPL prices with two purple trend lines and a black parallel trend channel. The black trend channel contained prices since April 2010 and alerted us of the recent Apple top.
AAPL pulled away from trend channel resistance a few weeks ago and is now approaching the upper purple trend line. This trend line coincides with the 200-day SMA at 588 and will be important support. How AAPL reacts to this support may well set the stage for the Nasdaq and S&P 500.
The Profit Radar Report looks at all major markets (and some major players like Apple) to identify high probability, low-risk trading opportunities (or upset Apple carts).
|
