Forgive me for using the much overused “B”-word (bubble) in my headline, but it appears unfashionable nowadays to write any article without a reference to the B-word (I believe there’s a significance to that. More below).
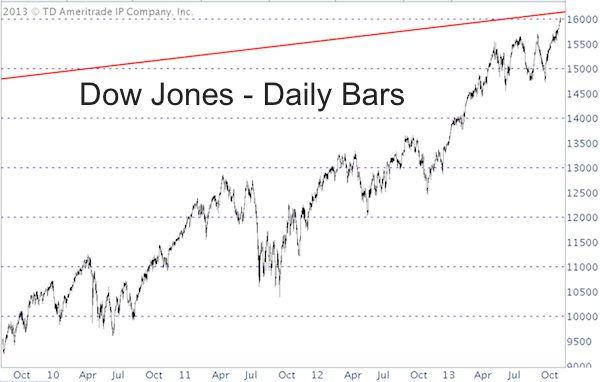
The Dow Jones (DJI: ^DJI) is chipping away at round number resistance at 16,000.
Round number resistance in itself is enough to capture the media’s attention and imagination. Combine this with the media’s eagerness to see a bubble burst and you have a perfect recipe for disaster, right?
The First Bubble Seen in Advance?
This would be the first bubble seen in advance, so a disaster here is very unlikely.
What about Dow Jones 16,000, is it significant resistance?
Yes and no.
Dow Jones 16,000 is round number resistance, the same as 1,800 for the S&P 500 (SNP: ^GSPC). Prices do tend to struggle briefly around round number resistance.
The Dow Jones chart below highlights round number resistances from 10,000 – 16,000 (purple lines).

But there is more important resistance for the Dow Jones and by extension the Dow Jones Diamonds ETF (NYSEArca: DIA).
Double Whammy Resistance
The red trend line goes back many many years and provides more important resistance for the Dow Jones than the round number resistance in itself.
This trend line resistance was first featured in the August 7 edition of the Profit Radar Report and was used as an eventual target for the QE bull market.
Since the two levels are only separated by 150 points, there is stiff resistance in the low 16,000s.
Will the Dow Jones be able to overcome Dow 16,000? Will the S&P 500 be able to overcome 1,800?
Eventually, probably yes. The key is eventually and likely after some ‘short-term damage.’
I don’t use trend lines as a stand alone indicator or forecasting tool. However, resistance levels like the above-mentioned trend line act as ‘technical handrails.’
In particular, I am using this trend line in combination with a duo of indicator that has directly ousted the May, August, and September declines as only temporary corrections.
Here’s what this trusty duo of indicators says is next for stocks:
Divergences and Their Immediate Effect on the S&P 500 (and Dow Jones)
A long-term chart and detailed analysis for the Dow Jones and S&P 500 is available to subscribers of the Profit Radar Report.
Simon Maierhofer is the publisher of the Profit Radar Report. The Profit Radar Report uses technical analysis, dozens of investor sentiment gauges, seasonal patterns and a healthy portion of common sense to spot low-risk, high probability trades (see track record below).
Follow Simon on Twitter @ iSPYETF or sign up for the iSPYETF Newsletter to get actionable ETF trade ideas delivered for free.

|