Wall Street anxiously anticipates the outcome of this week’s two-day FOMC conclave.
Taper or no taper is the question … and it will be answered on Wednesday around 2pm EST.
Until then, speculations run wild.
I don’t participate in the speculation for two reasons:
-
The market’s reaction is simply unpredictable (more below).
-
Technical analysis usually provides some clues even before the Fed announces anything.
The timelines in the S&P 500 chart below mark all 2013 FOMC meetings.
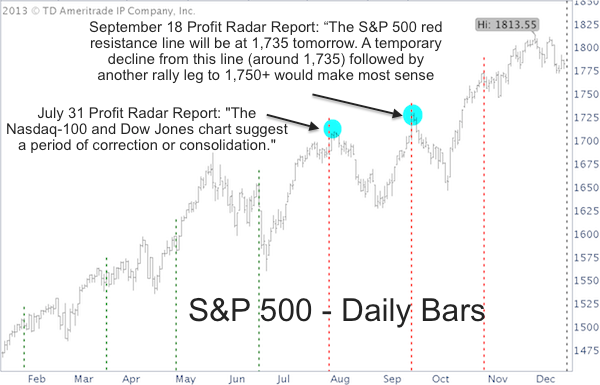
The first three meetings of the year were near-term bullish for the S&P 500 and S&P 500 ETF (NYSEArca: SPY), but eventually gave way to new lows.
The last four FOMC meetings were all followed by immediate declines.
The September 18 meeting (blue dot) was followed by an exciting twist. Most of Wall Street and the financial media expected the Fed to announce tapering at their September 18 FOMC meeting.
Surprise! The Fed did the unthinkable and continued unbridled QE. The S&P 500 (SNP: ^GSPC) soared the day of the announcement and a few hours on the next day, but dropped lower thereafter.
More or less ignoring the Fed’s noise, the September 18 Profit Radar Report published the projection chart below and warned:
“The S&P 500 red resistance line will be at 1,735 tomorrow. A temporary decline from this line (around 1,735) followed by another rally leg to 1,750+ would make most sense (see projection).”
What about the July 31 FOMC meeting? The July 31 Profit Radar Report stated that: "The Nasdaq-100 and Dow Jones chart suggest a period of correction or consolidation."
What do technicals say this time around?
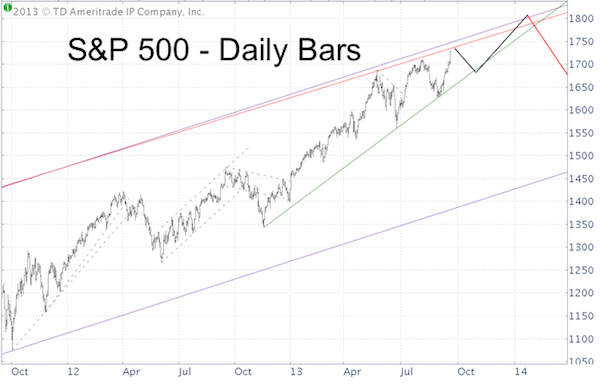
Technicals allow for some near-term weakness and a test of the 50-day SMAs for the S&P 500 and Dow Jones (DJI: ^DJI). I favor the odds for a year-end rally, but with sentiment at multi-year bullish extremes, any move below support would caution of a sizeable drop.
A more detailed technical forecast for the S&P 500 and Dow Jones, along with a chart that highlights important support, is available here: S&P 500 and Dow Jones Short-term Forecast
Simon Maierhofer is the publisher of the Profit Radar Report. The Profit Radar Report presents complex market analysis (stocks, gold, silver, euro and bonds) in an easy format. Technical analysis, sentiment indicators, seasonal patterns and common sense are all wrapped up into two or more easy-to-read weekly updates. We are accountable for our work, because we track every recommendation (see track record below).
Follow Simon on Twitter @ iSPYETF or sign up for the FREE iSPYETF Newsletter to get actionable ETF trade ideas delivered for free.

|
