The U.S. Geological Survey estimates that every American born in 2008 will use 1,309 pounds of copper during their lifetime for necessities, lifestyles and health.
Copper is the most widely used metal, that’s why it’s said to be the only asset class to have a Ph. D. in economics.
Many articles have been written about copper’s predictive power for stocks, but before we get there, let’s take a look at what cooper is up to.
The long-term copper chart highlights several support/resistance levels. Most significant at this point is strong support right around 3.
Prices sliced below 3 on Tuesday, but found support at the descending green support line.
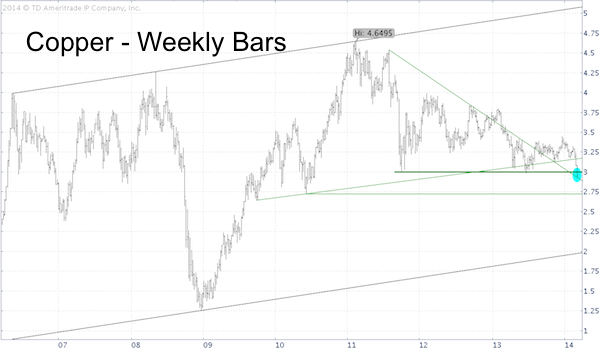
This appears to me an important juncture for copper. Further weakness here would open the door for a continued decline with initial support around 2.75.
What does the breakdown in copper prices mean for stocks?
The chart below plots copper against the S&P 500 over the past two years.
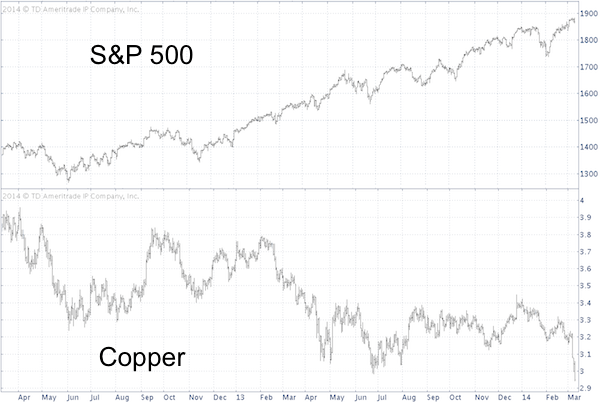
Obviously, something is wrong with the idea that copper serves as a crystal ball for the S&P 500. Copper topped in February 2011 and has been in a down trend ever since.
Quite to the contrary the S&P 500 (SNP: ^GSPC) has been in a persistent up trend.
Looking at this chart one wonders how copper earned its reputation as a “Ph. D. of economics.”
This is truly puzzling, especially when looking at the long-term correlation between copper and the S&P 500 (NYSEArca: SPY).
A 1959 – 2013 comparison between copper and the S&P 500 is available here:
Indicator Exposed: ‘Dr. Copper’ is More Quack Than Doctor
Simon Maierhofer is the publisher of the Profit Radar Report. The Profit Radar Report presents complex market analysis (S&P 500, Dow Jones, gold, silver, euro and bonds) in an easy format. Technical analysis, sentiment indicators, seasonal patterns and common sense are all wrapped up into two or more easy-to-read weekly updates. All Profit Radar Report recommendations resulted in a 59.51% net gain in 2013.
Follow Simon on Twitter @ iSPYETF or sign up for the FREE iSPYETF Newsletter to get actionable ETF trade ideas delivered for free.

|
