|
|
| Double S&P 500 Sell Signal Warns of Even Lower Prices |
| By, Simon Maierhofer
|
| Friday April 11, 2014 |
|
|
|
|
| It’s been an ugly week. Is the worst over? Here’s a look at two dominant market forces: Technical analysis and seasonality. |
|
“S&P 500 Caps Worst Two-Day Drop Since June as Tech Slides” – Bloomberg
“Markets Face more Turbulence as Earnings Ramp Up” - CNBC
“2014 Crash Will be Worse Than 1987’s: Marc Faber” – CNBC
It’s been a while since investors have been confronted with such gloomy headlines.
Two indicators point towards more damage to come:
Seasonality
The March 30 Profit Radar Report featured an S&P 500 (SNP: ^GSPC) seasonality chart (limited chart shows below) and proposed that: “The S&P 500 will rally to a new high in April (resistance is at 1,893), but stocks will sell off after their April high.”
Technical Analysis
-
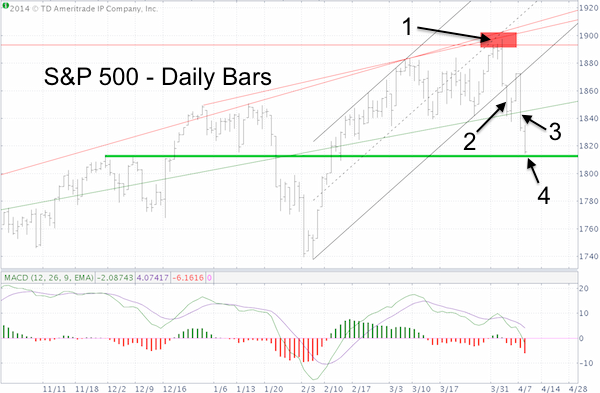
The March 30 and April 2 Profit Radar Report warned of a dense cluster of overhead resistance at 1,893 – 1,900 (see #1 on chart).
-
The April 7 Profit Radar Report pointed out that: “The S&P triggered a MACD sell signal (#2). Today’s decline looks like an important building block for a multi-week or multi-month bearish structure.”
-
The S&P 500 dropped below trend channel support (#3) going all the way back to the 2009 low (more info below).
-
Although the S&P 500 (NYSEArca: SPY) arrived at technical support at 1,815 – 1,810 (#4), which may cause a bounce, we are not yet seeing the kind of oversold readings indicative of a bottom (i.e. MACD is not decisively oversold).
Summary
The S&P reversed at resistance, triggered a MACD sell signal and closed below support. Seasonality is bearish.
With or without bounce from support, further down side seems very likely. Prior support around 1,845+/- is now resistance.
Only a drop to the next support level or a rally above resistance may spark renewed buying.
How can you identify the kind of key support level destined to spark a rally? Here’s a quick interactive test designed to tickle investor minds (and spot key support/resistance levels).
How S&P 500 ‘Puppet Master’ Covertly Pulls Strings
Simon Maierhofer is the publisher of the Profit Radar Report. The Profit Radar Report presents complex market analysis (S&P 500, Dow Jones, gold, silver, euro and bonds) in an easy format. Technical analysis, sentiment indicators, seasonal patterns and common sense are all wrapped up into two or more easy-to-read weekly updates. All Profit Radar Report recommendations resulted in a 59.51% net gain in 2013.
|
|
|
|
|
|
|
|
|
|
|
|
|
|
