I’ve been writing a lot about the power of long-term trend channels. One of them pegged the S&P’s April 4 all-time high (more details below).
Today we’ll take a look at two short-term channels. One of them explains today’s bounce and will likely tell us if it’s ‘fake or real.’
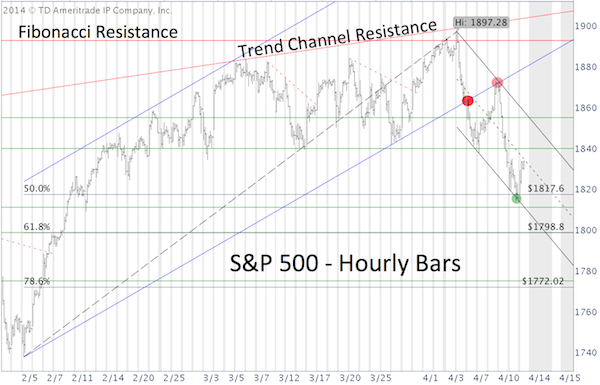
The blue channel contained the S&P 500 (SNP: ^GSPC) from February 5 until it broke below it on April 5 (red dot).
The S&P 500 tested this trend line once more on April 10. Regarding such a back test, I wrote the following in the April 9 Profit Radar Report.
“Often when a trend line is broken, prices will double back and test the line before peeling away in the direction of the break. I’ve seen this scenario play out many times, but for it to work (in this case a sell signal), the test of the trend line (at 1,872) has to be quick” (orange dot).
From there, the S&P 500 transitions from the blue channel into the black channel.
Sunday’s Profit Radar Report stated that the black channel: “Reveals support at Friday's close (1,814 - green dot) and resistance around 1,834 (dashed centerline) and 1,850.”
Today the S&P 500 (NYSEArca: SPY) bounced to test the dashed centerline at 1,834.
The down trend remains in tact as long as trade stays within the channel. A move outside the channel would warn of higher prices.
What about the long-term channel mentioned above?
It almost acts like a ‘puppet master’ for the S&P 500. More details on where this channel is located and how it helps investors make future decisions can be found here:
How S&P 500 ‘Puppet Master’ Covertly Pulls Strings
Simon Maierhofer is the publisher of the Profit Radar Report. The Profit Radar Report presents complex market analysis (S&P 500, Dow Jones, gold, silver, euro and bonds) in an easy format. Technical analysis, sentiment indicators, seasonal patterns and common sense are all wrapped up into two or more easy-to-read weekly updates. All Profit Radar Report recommendations resulted in a 59.51% net gain in 2013.
Follow Simon on Twitter @ iSPYETF or sign up for the FREE iSPYETF Newsletter to get actionable ETF trade ideas delivered for free.

|
