2013 is in the bag and I’m probably not the first one to tell you that it was the best annual performance for the S&P 500 (SNP: ^GSPC) since 1997.
But that’s in the past, here’s what’s important today: Did the 2013 strong S&P 500 mortgage 2014? This probably depends on how many buyers are still out there.
A stock market without new buyers fizzles out like a fire without wood. Are there enough buyers left to drive prices higher in 2014?
The chart below plots the S&P 500 against four different sentiment measures:
-
CBOE SKEW Index (10-day SMA)
-
Percentage of bullish advisors polled by Investors Intelligence (II)
-
CBOE Equity Put/Call Ratio (inverted, 10-day SMA)
-
Percentage of bullish investors polled by AAII
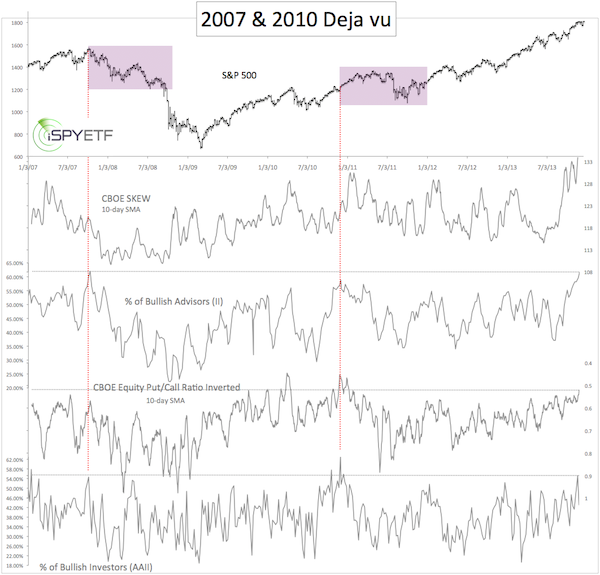
To filter out some of the noise created by six years of daily data, I’m using the 10-day simple moving averages (SMA) for the CBOE SKEW Index (click here for a detailed explanation of the SKEW Index) and CBOE Equity Put/Call Ratio. The put/call ratio has been inverted to provide a better visual.
How committed are investors to the current rally?
-
The SKEW is at a 15-year high.
-
The percentage of bullish advisors is nearly as high as in October 2007.
-
The put/call ratio is the lowest since December 2010.
-
Individual investors are the most bullish in two years.
In short, buyers are already committed, which means there are not many individual buyers left (of course the Federal Reserve is still out there).
Buyers Beware
Sentiment was equally frothy only twice in the past ten years: October 2007 and December 2010 (purple boxes).
We all know what happened in 2007. In 2010 the S&P 500 (NYSEArca: SPY) and Dow Jones (NYSEArca: DIA) continued higher for several weeks before giving back a year’s worth of gains in a matter of weeks.
Summary
At this point we do not know how much upside is left (I believe it’s limited), but that there should be a correction, quite possibly a nasty correction, in the not so distant future.
Rather than hitting the sell everything button right now, it may be smarter to equip equity holdings with a trailing stop loss.
This allows you to milk the upside and limit down side risk.
The most effective stop-loss levels for stocks in general, and Dow Jones in particular, is revealed here. It’s so effective; I call it legal insider information.
Insider Trading just Became Legal – The Perfect Stop-loss Level
Simon Maierhofer is the publisher of the Profit Radar Report. The Profit Radar Report presents complex market analysis (stocks, gold, silver, euro and bonds) in an easy format. Technical analysis, sentiment indicators, seasonal patterns and common sense are all wrapped up into two or more easy-to-read weekly updates. We are accountable for our work, because we track every recommendation (see track record below).
Follow Simon on Twitter @ iSPYETF or sign up for the FREE iSPYETF Newsletter to get actionable ETF trade ideas delivered for free.

|
