The Nasdaq is putting on a facade. It looks strong, but has weak ‘bones.’
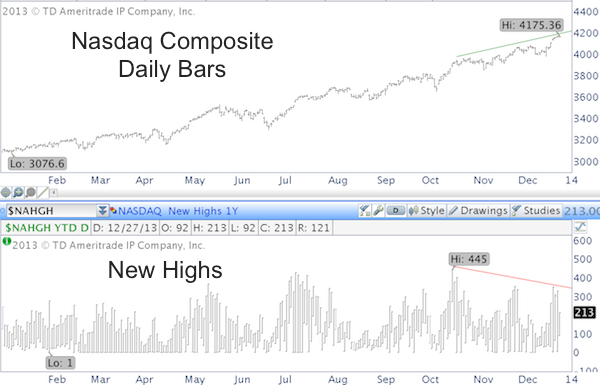
The chart below plots the Nasdaq Composite (Nasdaq: ^IXIC) against the number of new 1-year highs (of stocks contained in the Nasdaq Composite).
Since October 18, the Nasdaq Composite is up 6.4% (the Nasdaq-100 is up 6.8%). Since then the basket of stocks that makes up the Nasdaq gained 6.4%. It would be reasonable to also expect a higher number of 1-year highs. That’s not the case though.
On October 18, there were 445 new highs. Today there are only 213 new 1-year highs, although the Nasdaq hit a new 12+ year high.
It is said that this kind of divergence reflects investors’ struggles to find stocks worth their money and trust. As prices continue to rise, value is harder to find and investors become more selective as they hone in on just a few stocks.
According to this theory, a few individual stocks mask the weakness of the collective index. Is that the case now?
Since October 18, the top four holdings of the Nasdaq-100 ETF (Nasdaq: QQQ) – AAPL, MSFT, GOOG, AMZN – have gained 12.75% on average (AAPL: +11.56%, MSFT: +6.92%, GOOG: +10.58%, AMZN: +21.95%). The Nasdaq-100 rose by only 6.8%.
The theory is true; AAPL, GOOG and AMZN are picking up the slack of the increasing amount of laggards.
Theoretically this can go on for a while, but in a practical sense it suggests that risk is increasing.
This doesn’t mean that everything should be sold at this very moment, but investors should pinpoint the support – that once broken – will signal that the rally is over.
This must hold support for the Nasdaq is quite a bit below current trade, and only focusing on key Nasdaq support would result in a 5-10% drawdown.
Fortunately other indexes provide a much closer early warning signal. The Dow Jones chart reveals a very clear must-hold support not far below current levels.
To view the must hold support for the Dow Jones (DJI: ^DI) click here:
Key Dow Support: The Difference Between ‘Pop and Drop’ and Continued Rally
Simon Maierhofer is the publisher of the Profit Radar Report. The Profit Radar Report presents complex market analysis (stocks, gold, silver, euro and bonds) in an easy format. Technical analysis, sentiment indicators, seasonal patterns and common sense are all wrapped up into two or more easy-to-read weekly updates. We are accountable for our work, because we track every recommendation (see track record below).
Follow Simon on Twitter @ iSPYETF or sign up for the FREE iSPYETF Newsletter to get actionable ETF trade ideas delivered for free.

|
