Crude oil has plummeted from $107 to $84.
Are falling oil prices good for the economy or are they a reflection of a weak economy?
It’s a chicken or egg kind of question.
The media is certainly at a loss, as those actual headlines from 2011 and 2012 illustrate:
-
AP: “Higher oil prices threaten global economy” – March 10, 2011
-
Reuters: “Oil prices rise on economic optimism” – January 10, 2012
-
AP: “Higher oil prices offset worries about global economic recovery” – May 25, 2011
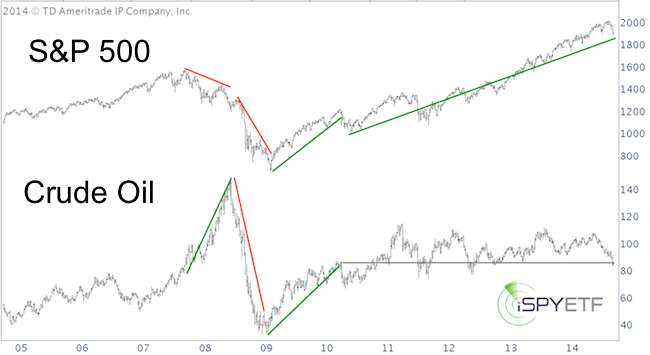
A simple look at a comparison chart (S&P 500 vs XLE) shows that oil and stock prices can, and often will move independently from each other.
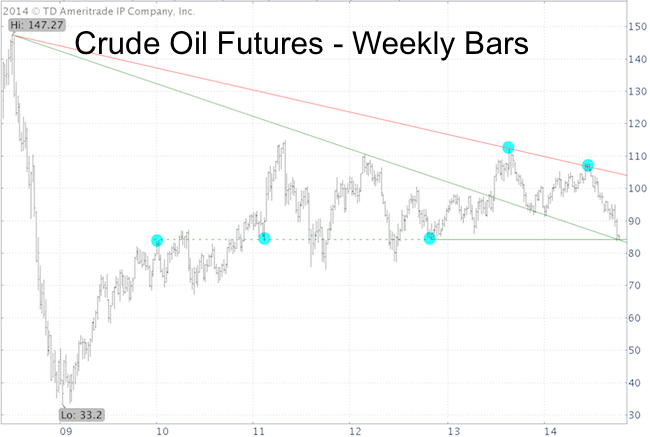
Regardless on how oil prices affect the overall stock market, oil prices are at important support.
Crude Oil Support
The crude oil chart shows trade being repelled by red trend line resistance in August 2013 and June 2014.
Complex Analysis Made Easy - Sign Up for the FREE iSPYETF E-Newsletter
After a 21% drop from high to low, oil is sitting right above important support around 84.
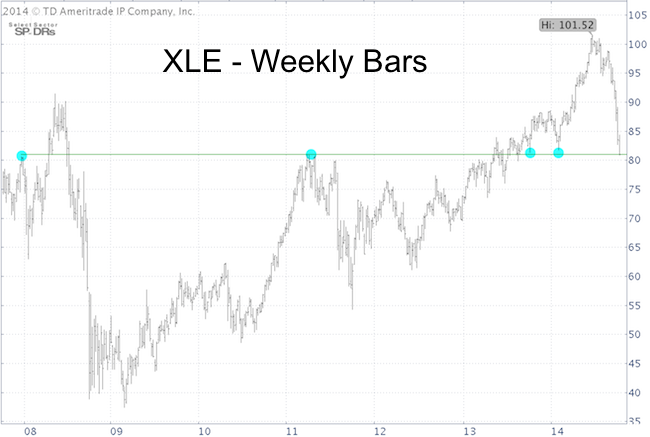
Energy Select Sector SPDR Support
The Energy Select Sector SPDR ETF (NYSEArca: XLE) matched crude oils gush lower, down 20% from its high.
The 81 level offered important support in December 2007, March/April 2011 and February 2014 (blue dots).
Considering the steepness of the recent selloff and proximity to important support, there’s a good chance oil and XLE will find a tradable bottom somewhere around current trade. If they don't, we might be about to see a washout sale.
Simon Maierhofer is the publisher of the Profit Radar Report. The Profit Radar Report presents complex market analysis (S&P 500, Dow Jones, gold, silver, euro and bonds) in an easy format. Technical analysis, sentiment indicators, seasonal patterns and common sense are all wrapped up into two or more easy-to-read weekly updates. All Profit Radar Report recommendations resulted in a 59.51% net gain in 2013.
Follow Simon on Twitter @ iSPYETF or sign up for the FREE iSPYETF Newsletter to get actionable ETF trade ideas delivered for free.

|
