Corporate bonds are carving out a potential bearish pattern (more details below). Is there enough of a correlation between corporate bonds and the S&P 500 to make this worrisome for stock investors?
Figure 1 shows the correlation between the S&P 500 (SNP: ^GSPC) and the iShares iBOXX $ Investment Grade Corporate Bond ETF (NYSEArca: LQD).
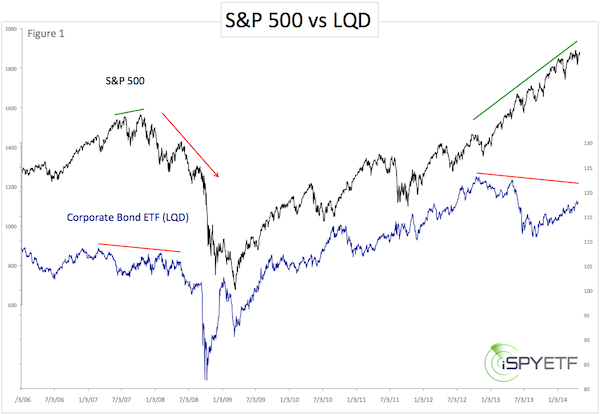
The relationship between S&P and LQD runs hot and cold, vacillating between taking the same path and parting ways.
Some have argued that there was a bearish divergence before the 2008 crash, similar to the bearish divergence right now.
This is true, but the interest environment prior to 2007 was different than today, and we know that interest rates affect bonds (and stocks).
Is it possible to make an apples to apples comparison between 2007 and today?
Figure 2 takes interest rates into consideration. The lower graph reflects LQD divided by the 10-year Treasury yield (TNX), which is then plotted against the S&P 500 (upper graph).
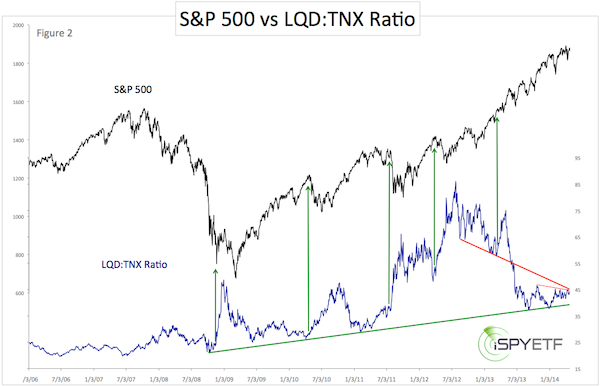
At first sight, there are no meaningful parallels between the LQD:TNX ratio and the S&P 500 (NYSEArca: SPY).
However, the LQD:TNX ratio seems to adhere to trend line support and resistance. For example, LQD:TNX has been climbing higher based on the green support trend line and has been kept lower by two resistance trend lines.
Since the LQD:TNX ratio is butting against resistance, it may be interesting to explore what happens if the ratio breaks higher.
This may be the most valuable clue offered by the chart: Generally when the ratio spikes (green arrow), the S&P 500 slides (exception: February 2013).
An LQD:TNX ratio spike would be caused by falling interest rates and/or rising LQD prices.
But here is another caveat: Corporate bond ETFs (represented by LQD) are developing a bearish technical pattern that suggests an upcoming bull trap and fairly significant decline.
This interesting dynamic is discussed in more detail here:
Corporate Bonds Inching Towards Bull Trap Territory
Simon Maierhofer is the publisher of the Profit Radar Report. The Profit Radar Report presents complex market analysis (S&P 500, Dow Jones, gold, silver, euro and bonds) in an easy format. Technical analysis, sentiment indicators, seasonal patterns and common sense are all wrapped up into two or more easy-to-read weekly updates. All Profit Radar Report recommendations resulted in a 59.51% net gain in 2013.
Follow Simon on Twitter @ iSPYETF or sign up for the FREE iSPYETF Newsletter to get actionable ETF trade ideas delivered for free.

|
