We all have our fears and we all need to face them eventually. My fear as a stock market analyst and forecaster is being wrong.
Unfortunately, that happens more often than I’d like it to be. Still, I just can't get used to that feeling. Every time the market outsmarts me, I analyze what happened.
This analysis benefits me – as I try to reduce the amount of future ‘wrongs’ and increase the amount of ‘rights’ – and I thought it might benefit you. So here’s my latest slip up along with the ‘post game’ analysis.
In short, the S&P 500 pushed higher than I expected. I thought the S&P would reverse lower around 1,492. Here’s why:
What Went Wrong
In late January triple resistance converged at 1,492. The chart below shows two of the three resistance levels (the third was a 70-day trend channel, not shown because it doesn’t display well on the monthly chart).
The red trend line connects the 2002 low and 2011 high. The gray line is a parallel channel that connects the 2002 and 2009 low with the 2007 high. One resistance line is often enough to stop an advance, but triple resistance is pretty solid (at least so I thought).
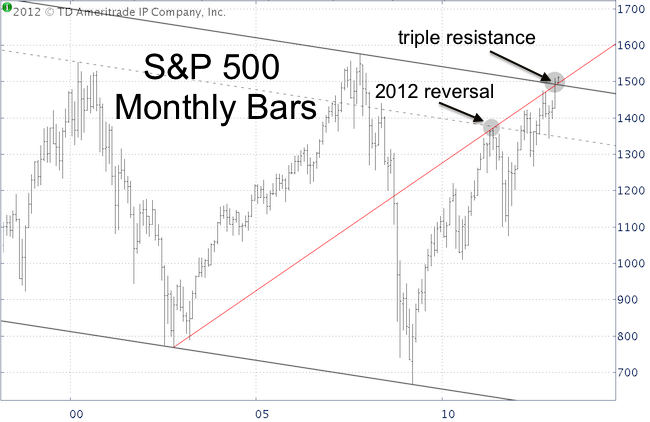
Additionally, I ‘had faith’ in the repelling ability of the 10+ year parallel channel, because a very similar channel (dashed gray line: 2002 and 2009 low connected with the 2000 high) repelled the S&P in 2011 and caused a 20% decline.
But nothing trumps price action, and regardless of the rhetoric, the S&P went higher.
What Went Right
Prior to viewing resistance around 1,490 as a reversal point, I considered it a target. In the January 2 Profit Radar Report I wrote that: “Around 1,490 is now key resistance and the most likely target for this advance.”
This was consistent with prior comments, made at a time when Wall Street, the media, and investors were bearish (partially because of the fiscal cliff).
From the September 30, 2011 Profit Radar Report:
“The September 14 recovery highs for the S&P, Dow, Russell 2000, and XLF were all accompanied by new RSI highs. It would be rare for stocks to form a long-term peak without a bearish price/RSI divergence. Because of this lack of divergence we expect new recovery highs.”
This was reiterated on December 2: “The decline from September 14 – November 16 was a correction on the S&P’s journey to new recovery highs. This scenario is supported by the lack of bearish price/RSI divergences at the September 14 high, continuous QE liquidity, and bullish seasonality. There is no specific target, but any new recovery high marked by a bearish price/RSI divergence could mark the end of this rally.”
The move above 1,492 unlocked my 'alternate' target range of 1,515 - 1,530. The S&P has stalled here, in fact five daily doji candles last week reflect indecision. But indecision doesn't have to be bearish. It will take a break below nearby support to unlock the potential for a somewhat deeper correction.
What’s the key lesson? An up market, especially in a QE world, should get the benefit of the doubt until momentum is broken. Instead of using technical analysis to pinpoint a reversal range, I should have followed the trend and focused on support levels, that - once broken - confirm a turn around.
The meaning of the recent string of doji candlesticks along with a comprehensive 2013 forecast is available via the Profit Strategy Newsletter.
|
