Buy low, sell high. It’s easier said than done, but you’d at least expect the ‘pros’ to be reasonably good at this.
Wrong! Professional money managers already racked up an impressive lousy track record for 2014.
On February 7, I wrote an article titled: "Investment Managers Slash Equity Exposure by 50%," and published the chart below.
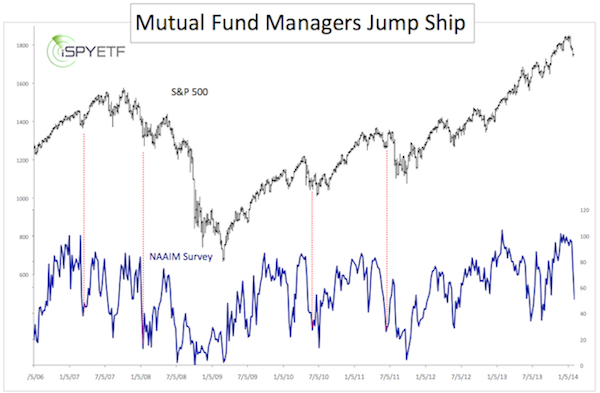
The article commented that such an irrational move out of equities usually leads to a rebound of the S&P 500.
The chart data is based on the NAAIM (National Association of Active Investment Managers) survey, which is updated every Thursday.
Last week, the NAAIM survey was updated on February 6, which means that most of the data is received on February 4 and 5.
So in reality professional investment managers slashed their equity exposure by 50% right around February 4 and 5.
The S&P 500 (SNP: ^GSPC) tumbled to its 2014 low on … you guessed it … February 5 at 1,738.
That’s when active managers sold. The S&P 500 and S&P 500 ETF (NYSEArca: SPY) rallied over 5.2% since. The Nasdaq QQQ ETF (Nasdaq: QQQ) soared 7.11% since.
If the same thing happened to you (buy or sell at the worst of times), take heart, the pros didn’t do any better.
When harping on the skills (or lack thereof) of professional managers I’m often reminded of this saying: “Don’t throw stones if you’re sitting in a glass house.”
To be brutally honest, the 90 S&P point rally didn’t trip the buy trigger outlined in my Profit Radar Report, but at least we saw this rally coming.
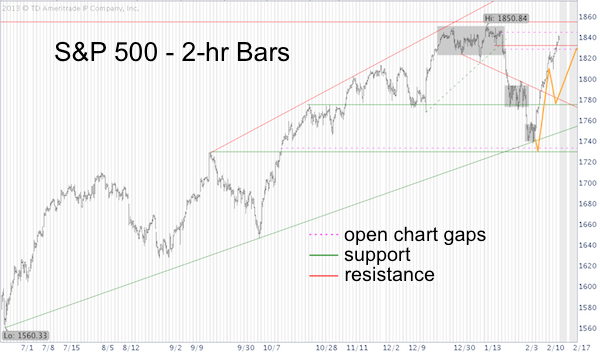
The February 2 Profit Radar Report stated that: “Our preferred forecast calls for a brief dip towards 1,730 followed by an energetic rally towards 1,830 for the S&P 500,” and the February 12 Profit Radar Report mentioned 1,845 (open chart gap) as target.
The February 5 update featured this visual projection (yellow line) of the ‘energetic rally towards 1,830’ (as illustrated by the yellow line we expected the S&P 500 to close the open chart gap at 1,733.45 before rallying strongly).
The latest NAAIM data shows that the average investment manager increased equity exposure from 50.97% to 73.26%.
That’s interesting, but it’s impossible to draw any predictive conclusions from this one data point change.
However, the S&P 500 has surpassed our initial up side target ~1,830 and came within striking distance of closing the 1,845 gap, so risk is rising.
The Dow Jones (NYSEArca: DIA) is close to 14-year key resistance level, which delineates bearish risk from bullish potential.
In short, there's no reason to be complacent around current levels and the pros may feel some redemption if trade revisits the previous low.
Of course, the 'pros' will look like complete fools if the big fat buy signal given by this indicator pans out.
New Spin on Old Indicator Gives Big Fat Buy Signal
Simon Maierhofer is the publisher of the Profit Radar Report. The Profit Radar Report presents complex market analysis (S&P 500, Dow Jones, gold, silver, euro and bonds) in an easy format. Technical analysis, sentiment indicators, seasonal patterns and common sense are all wrapped up into two or more easy-to-read weekly updates. All Profit Radar Report recommendations resulted in a 59.51% net gain in 2013.
Follow Simon on Twitter @ iSPYETF or sign up for the FREE iSPYETF Newsletter to get actionable ETF trade ideas delivered for free.

|
