After an already dismal year, gold has lost another 11% in the last five weeks.
Is this the last washout sell off before a sustainable rally?
One clue is provided by the Commitment of Traders (COT) report, which tracks the long and short gold futures positions of various types of traders.
Investors basically get a peek at what the ‘smart money’ and ‘dumb money’ is doing.
The chart below plots the SPDR Gold Shares ETF (NYSEArca: GLD) against the long gold positions held by Non-commercial traders. Non-commercials are large speculators.
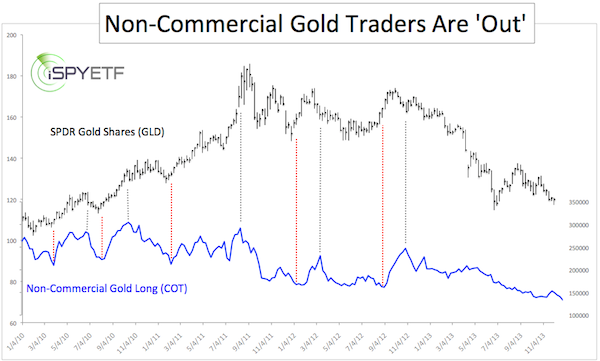
Even a brief glance at the chart shows that large speculators tend to find themselves on the wrong side of the trade (red and gray vertical lines).
The amount of long gold futures contracts owned by non-commercials has dropped to a five-year low.
The amount of gold tons held in the SPDR Gold ETF and iShares Gold Trust (NYSEArca: IAU) echoes the message of the above chart. The amount of gold held by gold ETFs GLD and IAU has shrunk over 30% since the beginning of the year.
Gold sentiment suggests that the worst of the decline is over. Unfortunately though, gold sentiment alone can be a haphazard indicator.
I always base my gold research on various types of indicators. Sentiment is one of them, technical analysis and seasonality another.
Quite frankly, technical analysis hasn't produced any good buy/sell signals for gold, GLD, IAU or the UltraShort Gold ProShares (NYSEArca: GLL) recently.
However, gold has very much respected technical support and resistance. The gold chart below was previously published in the Profit Radar Report. The blue dots highlight how well technical support and resistance has worked recently (and for the entire year for that fact).
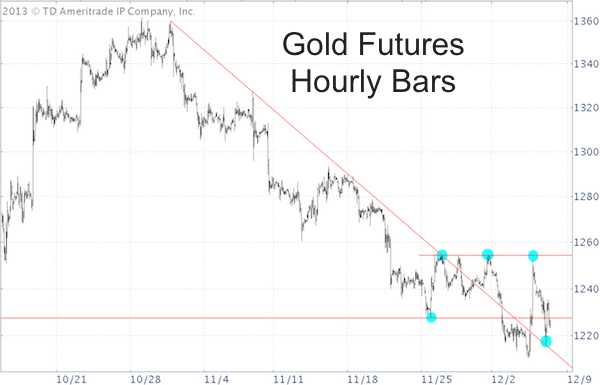
Near-term resistance is around 1,255. There’s no critical near-term support.
It appears to me that – with or without a bounce – a washout, ‘throw-in the towel’ type sell off is still missing.
We are now starting to gear up for the next long-term trade that may see a 200+ point move.
The long-term analysis for gold featured in the below article provides more details about the next 200+ gold trade.
Long-term Gold Analysis - When's the Time to Buy Gold?
Simon Maierhofer is the publisher of the Profit Radar Report. The Profit Radar Report presents complex market analysis (stocks, gold, silver, euro and bonds) in an easy format. Technical analysis, sentiment indicators, seasonal patterns and common sense are all wrapped up into two or more easy-to-read weekly updates. We are accountable for our work, because we track every recommendation (see track record below).
Follow Simon on Twitter @ iSPYETF or sign up for the FREE iSPYETF Newsletter to get actionable ETF trade ideas delivered for free.

|
