Boring or exciting, tortoise or hare, bonds or stocks?
A low interest rate environment generally favors stocks as investors flee from fixed-income vehicles into higher-octane stocks.
This has been a winning strategy. The SPDR S&P 500 ETF (NYSEArca: SPY) is up 25%, compared to a 3% loss for the iShares Barclays 7 – 10 year Treasury Bond ETF (NYSEArca: IEF).
However, one indicator suggests that 10-year Treasury bonds are about to catch a bid.
The indicator is the ratio between the S&P 500 Index (SNP: ^GSPC) and the iShares Barclays 7 – 10 Year Treasury Bond ETF (IEF).
The chart below plots IEF against the S&P 500 : IEF ratio.
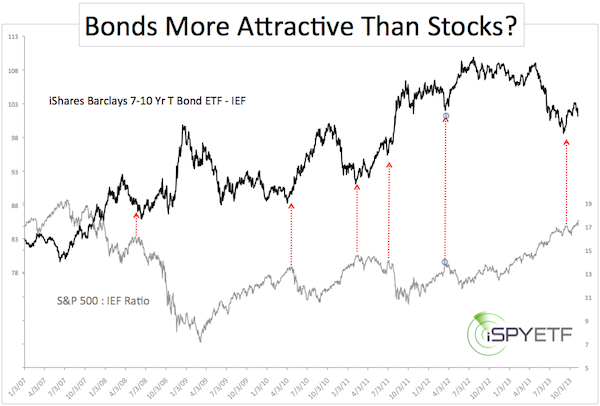
The red arrows highlight extremes in the S&P 500 : IEF ratio. More often than not an extreme in the ratio has coincided with lows for IEF and Treasury bonds in general, which includes the iShares Barclays 20+ Year Treasury ETF (NYSEArca: TLT).
The S&P 500 : IEF ratio as a bullish indicator for Treasury Bonds however, is in conflict with our technical analysis for the 10-year Treasury Note yield.
The longer-term trajectory for the 10-year rate seems to be up.
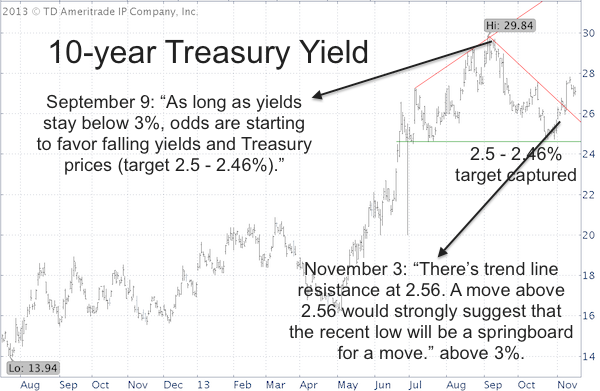
The second chart of the 10-year Treasury Note yield (Chicago Options: ^TNX) shows that yields have broken above a short-term resistance trend line, which seems to put yields on track to surpass their September high (see chart annotations for previous Profit Radar Report analysis).
In an ideal world all indicators always point in the same direction, but when is market analysis ever ideal? It even takes some hindsight to pinpoint actual ratio extremes highlighted above.
The indicators may be telling us that there's some short-term weakness for bond yields followed by a period of rising 10- year yields (with a target above 3%).
Does the S&P 500 : IEF ratio also apply to the S&P 500 Index?
A chart that plots the S&P 500 against the S&P 500 : IEF ratio can be found here. Although the chart isn't failproof, it sends a message that shouldn't be ignored. View S&P 500 vs S&P 500 : IEF ratio chart here.
Simon Maierhofer is the publisher of the Profit Radar Report. The Profit Radar Report uses technical analysis, dozens of investor sentiment gauges, seasonal patterns and a healthy portion of common sense to spot low-risk, high probability trades (see track record below).
Follow Simon on Twitter @ iSPYETF or sign up for the iSPYETF Newsletter to get actionable ETF trade ideas delivered for free.

|
