Most indexes have completely recovered from Friday’s mini sell off. Nevertheless, last week’s red candle left some technical ‘scars.’ In what sense?
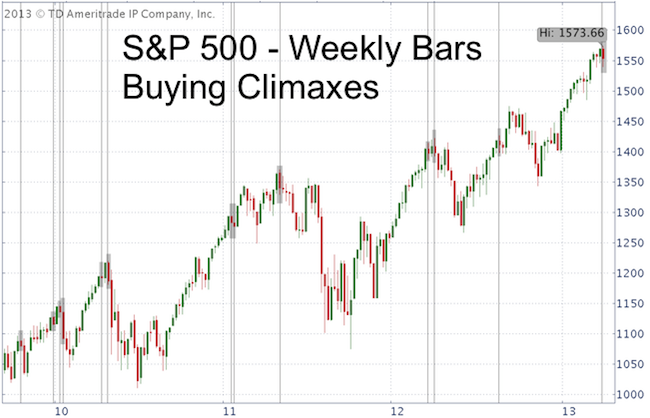
Last week marked a buying climax for the S&P 500 and 347 individual stocks. A buying climax occurs when a stock/index makes a 12-month high, but closes the week with a loss.
Since the 2009 low, the S&P 500 saw 13 buying climaxes. Buying climaxes are identified by gray boxes and vertical gray lines in the chart below.
What was the performance after each buying climax?
· 3 times a buying climax was followed by 10%+ corrections
· 4 times a buying climax was followed by marginal new highs (another 5 – 10 days of gains) before a sizeable decline
· 2 times a buying climax was followed by a minor correction
· 2 times a buying climax was followed by an immediate short-term low
Buying climaxes are generally bearish. According to Investor’s Intelligence they are a sign of distribution and indicate that stocks are moving from strong to weak hands.
The chart confirms Investor’s Intelligence’s definition and past precedents (at least since 2009) caution that the market’s recovery from a buying climax may be temporary (and treacherous) in nature.
For right now the trend is up. Since that could change quickly, the Profit Radar Report will supplement data like this with broader technical analysis, sentiment, seasonality and support/resistance levels to identify a low-risk opportunity to go short.
|
