On January 15, I published my full and complete 2014 S&P 500 forecast for subscribers of the Profit Radar Report.
It is impossible to get a full-year forecast correct, so publishing a detailed forecast with an actual projection of the ideal S&P 500 (SNP: ^GSPC) path really provides easy ammunition for ‘you were so wrong’ criticism.
But, if you can’t take criticism as a market forecaster, you are in the wrong business.
Since I follow so many indicators (technical analysis, chart patterns, Elliott Wave Theory, support/resistance levels, investor sentiment, money flows, seasonalities, cycles, etc.) it would be a cowardly waste of research not to ‘puzzle’ them together for a full-year big picture forecast.
Obviously, it wouldn’t be fair to paying subscribers to publish the entire forecast for free, but below is an interesting tidbit of the 2014 forecast.
The S&P 500 chart shows important support (green) and resistance levels (red).
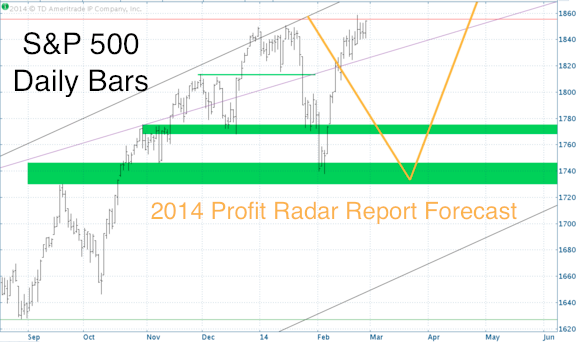
The key resistance level for the first quarter of 2014 was S&P 1,855.
The January 5 Profit Radar Report stated: “Sentiment and midterm election year seasonality suggest stocks are ripe for a multi-week correction, but technicals have yet to turn bearish. Elliott Wave Theory would easily allow for another small down – up sequence and larger scale high, later on in January. Fibonacci projection resistance going back to 2002 is at S&P 1,855.”
The S&P 500 topped at 1,851 on January 15 and fell below 1,740, exactly as outlined by the yellow projection, published in the 2014 forecast. Thereafter the S&P 500 rallied to new all-time highs, also as outlined by the yellow projection.
For the past week again the S&P 500 has struggled to overcome 1,855 and now has to prove it can stay above. This particular Fibonacci resistance is a Fibonacci projection level that goes all the way back to the 2002 lows.
As you can see, the form (and corresponding price levels) of the V-shaped correction/recovery pattern has been spot on, but the timing was off.
I didn’t expect the low until around mid-March.
The eventual high could mark a major top. Why? Two monster long-term stock market cycles actually cross paths this year and suggest a strong double-whammy market top (all details and charts discussed in the 2014 forecast).
Once we get to new all-time highs, we’ll have to see if any such high sports the tell-tale signs of a major top (I’ll be looking at certain bearish divergences that have helped identify similar tops in the past).
What about the short-term?
Up until last week the S&P and Dow Jones adhered to my short-term outlook, which proposed a strong rally from S&P 1,740 to 1,830, quite well.
However, the new all-time highs required an adjustment. The original short-term projection along with the adjusted short-term outlook for the S&P 500 (NYSEArca: SPY) and Dow Jones is available here, for free.
A Revised Short-term S&P 500 Outlook
Simon Maierhofer is the publisher of the Profit Radar Report. The Profit Radar Report presents complex market analysis (S&P 500, Dow Jones, gold, silver, euro and bonds) in an easy format. Technical analysis, sentiment indicators, seasonal patterns and common sense are all wrapped up into two or more easy-to-read weekly updates. All Profit Radar Report recommendations resulted in a 59.51% net gain in 2013.
Follow Simon on Twitter @ iSPYETF or sign up for the FREE iSPYETF Newsletter to get actionable ETF trade ideas delivered for free.

|
