The swift February recovery made Wall Street forget about the many warning signals stocks morse-coded to investors in January.
Selective short-term memory loss can be dangerous, so here’s a quick summary of why 2014 should be a tough year:
5 Reasons to Be Bearish
1. Two monster stock market cycles project a major S&P 500 (SNP: ^GSPC) top in 2014. Not just one, but two multi-decade cycles join for a potent sell signal (details available in the Profit Radar Report's 2014 Forecast)
2. On January 31, the Dow Jones violated its December closing low. Since 1950, there have been 31 prior first quarter December low violations. All but two (1996, 2006) led to further losses, averaging 10.9%.
3. The S&P 500 lost 3.6% in January, the Dow Jones 5.3%. Based on the January Barometer (as January goes, so goes the year), there’s a 73.3% probability 2014 will be a tough year.
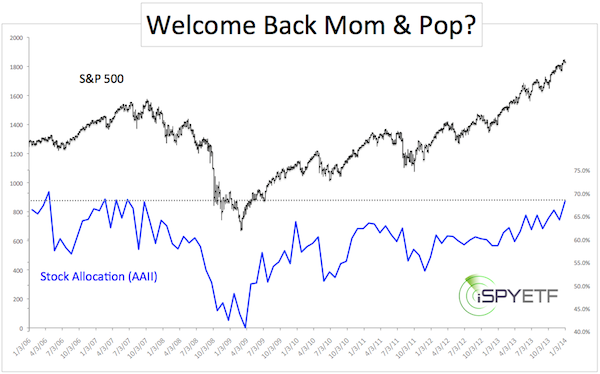
4. Mom & Pop investors have returned to Wall Street. The chart below (originally published on January 8) shows retail investors’ rediscovered romance with stocks.
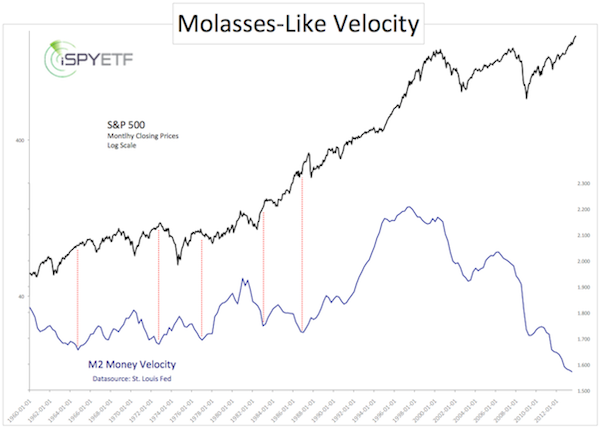
5. Money velocity is at its worst level since 1959. Money velocity is the frequency at which one dollar changes hands and is used to buy goods and services within a given period of time.
The chart below (originally published on January 22) plots the S&P 500 (NYSEArca: SPY) against M2 money velocity.
The Best Reason to Be Bullish
The February 23 Profit Radar Report (PRR) published the chart below. The yellow projection was first published on February 3 and forecasted a strong rally to S&P 1,830.
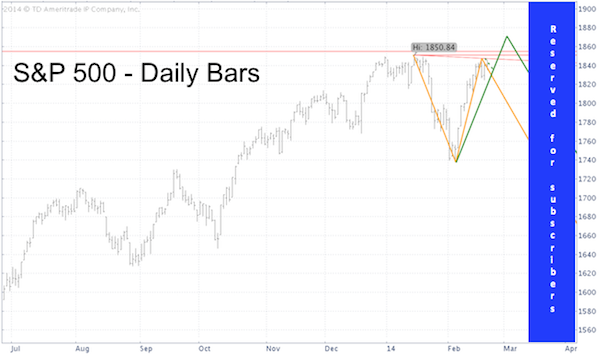
Although aggressive at the time, the S&P 1,830 target turned out to be too conservative and required an adjustment.
The green line reflects the adjusted projection introduced via the February 23 PRR.
As per the green projection, the S&P 500 was to rally to the up side target of 1,870 followed by a reversal lower.
The reversal lower however, could only be a brief correction (wave 2) within a larger 5-wave move to new all-time highs.
This outlook is based on Elliott Wave Theory (EWT). A detailed projection of this scanario (and explanation of EWT) is discussed in yesterday’s Profit Radar Report update.
A sneakpeek at the S&P 500 2014 projection (based on all the factors discussed above and many more) is available here:
An Updated Look at The Full 2014 S&P 500 Forecast
Simon Maierhofer is the publisher of the Profit Radar Report. The Profit Radar Report presents complex market analysis (S&P 500, Dow Jones, gold, silver, euro and bonds) in an easy format. Technical analysis, sentiment indicators, seasonal patterns and common sense are all wrapped up into two or more easy-to-read weekly updates. All Profit Radar Report recommendations resulted in a 59.51% net gain in 2013.
Follow Simon on Twitter @ iSPYETF or sign up for the FREE iSPYETF Newsletter to get actionable ETF trade ideas delivered for free.

|
