More than any other asset class, the Volatility Index (VIX) is subject to distinct patterns or biases that either help or hurt investors.
Being aware of the 3 VIX tricks discussed below will significantly increase the odds of a winning trade.
1) VIX Seasonality
I invite you to inspect the VIX seasonality chart below. Based on 25 years of trading history, there are two important seasonal turning points: July 2 and October 9.
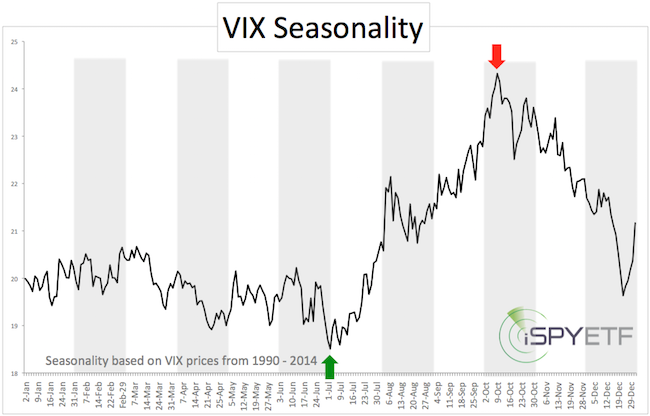
The VIX has a strong tendency to move higher starting in early July (green arrow), and to move lower after early October (red arrow).
For example, the June 23, 2015 Profit Radar Report stated that: “The VIX closed below the lower Bollinger Band for the first time since June 6, 2014. A close back above the lower Bollinger Band will be a buy signal. VIX seasonality is soon turning higher for the best VIX seasonal signal of the year.”
If you enjoy quality, hand-crafted research, >> Sign up for the FREE iSPYETF Newsletter
Shortly thereafter the VIX rallied from 12 to 20 and eventually to 50.
Due to the massive summer spike, this year’s October sell signal was shifted.
Nevertheless, the November spike (last chart, red arrow) offered a good setup to short the VIX, as the November 16 Profit Radar Report brought out: “The VIX closed below the upper Bollinger Band, which is a sell signal.”
The October sell signal is particularly intriguing because it gets magnified by a major bias of inverse VIX ETPs (Exchange Traded Products, such as ETFs and ETNs). This bias can be worth 0.25% per day for weeks.
2) Inverse VIX Bias
ETPs like the iPath S&P 500 VIX ETN (VXX) or the VelocityShares Daily Inverse VIX ETN (XIV) use futures (or options) to replicate VIX-related performance.
The performance of futures-based ETPs is typically cannibalized by a condition called contango. However, a bet on lower VIX prices allows investors to turn this generally harmful condition into a superbly beneficial tail wind.
Below is an admittedly dry explanation of contango, but I think you will find it well worth your time (no pain, no gain).
The VIX quoted in-day-to-day life is the CBOE Volatility Index (VIX) spot price (today’s VIX price). However, the futures used to create VIX ETPs are based on the future VIX price, which is almost always more expensive than the spot price. Over time the more expensive VIX futures decline in value, eventually converging with the spot price at expiration.
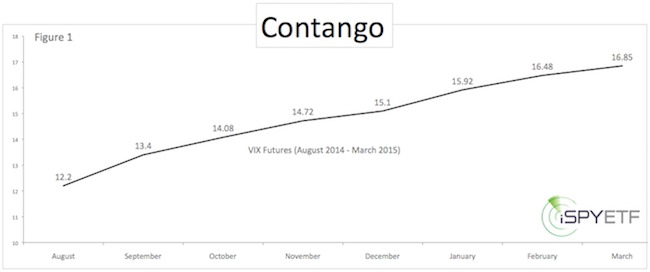
As time goes by, ETF providers are forced to continuously replace expiring futures with new (more expensive) futures (this process is called ‘rolling over’). The further away the futures expiration date, the bigger the time premium. This time premium and resulting value decay is called contango.
Contango generally exists when the VIX is trading below 20. The opposite of contango – backwardation, when future VIX prices are lower than at present – generally appears when the VIX trades above 20.
If you enjoy quality, hand-crafted research, >> Sign up for the FREE iSPYETF Newsletter
I wrote a detailed report on how to actually make contango work for investors back on August 24, 2014 (entire report available to subscribers of the Profit Radar Report).
Below are some of the findings and charts shared in this report:
The two biggest beneficiaries of the 'reverse contango' benefit are the VelocityShares Daily Short-term VIX ETN (NYSEArca: XIV) and ProShares Short VIX Futures ETF (NYSEArca: SVXY).
The chart below compares the VIX with its inverse counter part, XIV. Shown is the cumulative percentage return from January 3, 2011 to August 15, 2014.
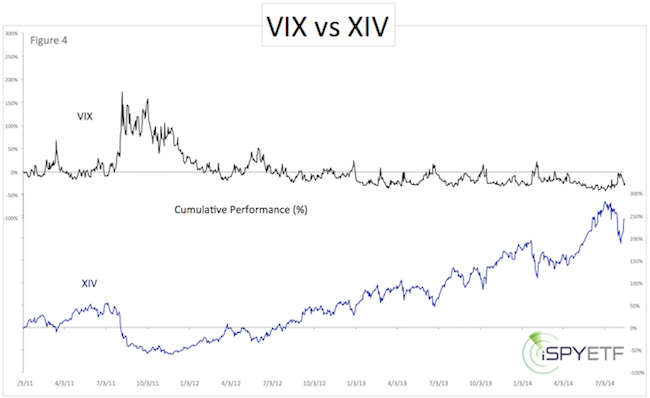
It quickly becomes obvious that XIV has risen much more than the VIX has fallen.
XIV is an inverse VIX ETN. For an apples to apples analysis of the excess return, here is a comparison between XIV and an inverse VIX (the VIX inversed).
-
Of the 911 trading days from January 3, 2011 to August 15, 2014, the inverse VIX had 484 up days and 427 down days. The inverse VIX had 1.13x more up than down days.
-
The average gain of 484 up days was 4.55%. The average loss of 427 down days was 5.85%. The average loss was 1.28x greater than the average gain.
-
Of the 911 trading days from January 3, 2011 to August 15, 2014, XIV had 522 up days and 389 down days. XIV had 1.34x more up than down days.
-
The average gain of 522 up days was 2.63%. The average loss of 389 down days was 3.18%. The average loss was 1.21x greater than the average gain (see figures 5 and 6).
-
From January 3, 2011 to August 15, 2014, XIV outperformed the inverse VIX by 217% (0.24% per day).
Obviously the reverse contango benefit doesn’t guarantee a profitable trade, but on average XIV provides a ‘daily edge’ of 0.25%. At times, the edge is much more pronounced, such as on November 30, 2015, when the VIX rose 6.68%, but XIV gained 0.74% (when it should have lost some 6.68%).
3) VIX Technical Analysis
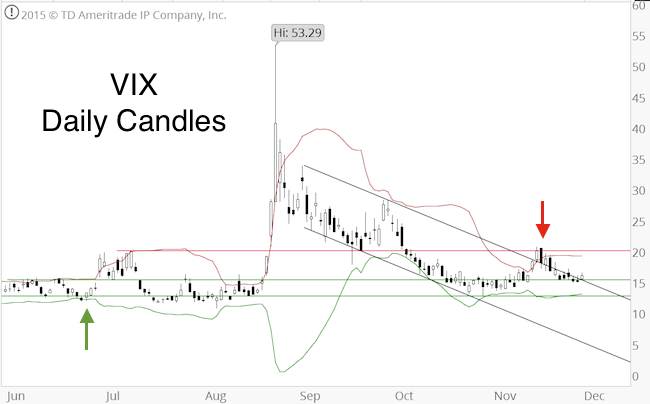
As you may have noticed from the two above Profit Radar Report quotes, the Bollinger Bands can be very helpful when it comes to spotting buy/sell signals, especially when they occur near the two major seasonal turning points (see chart below).
Simple support/resistance levels and trend channels can also be of help. The green/red arrows below highlight the buy/sell signal given by the Profit Radar Report.
Summary
Seasonality and technical analysis triggered a VIX sell signal on November 16.
The sell signal remains active and the ‘contango tailwind’ should by overall positive for XIV until late December.
However, for the first time since the start of the 2009 bull market, we are seeing signs of distribution (liquidity is drying up). This could become an issue when the next (bullish) VIX turning point arrives. More details here: Is the Stock Market Running out of Willing Buyers?
Simon Maierhofer is the publisher of the Profit Radar Report. The Profit Radar Report presents complex market analysis (S&P 500, Dow Jones, gold, silver, euro and bonds) in an easy format. Technical analysis, sentiment indicators, seasonal patterns and common sense are all wrapped up into two or more easy-to-read weekly updates. All Profit Radar Report recommendations resulted in a 59.51% net gain in 2013 and 17.59% in 2014.
Follow Simon on Twitter @ iSPYETF or sign up for the FREE iSPYETF Newsletter to get actionable ETF trade ideas delivered for free.
If you enjoy quality, hand-crafted research, >> Sign up for the FREE iSPYETF Newsletter
|
