Price action trumps every other indicator, and the S&P’s eight-day 100-point rally has turned the dashboard of indicators overwhelmingly green.
There are just a couple of signals that refuse to jump on the bullish bandwagon.
Trading Volume
The chart below plots the S&P 500 (SNP: ^GSPC) against NYSE trading volume.
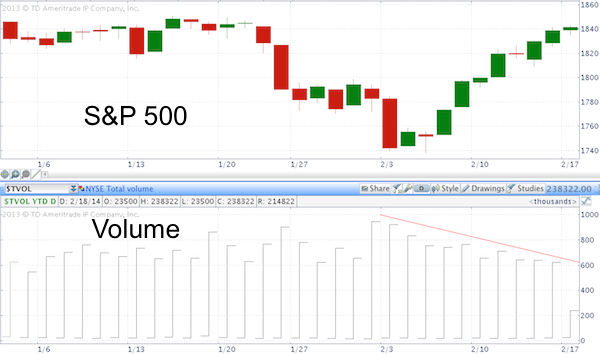
It’s quite obvious that volume did not confirm the direction of the S&P 500 and stocks in general.
The same can be said with the percentage of stocks trading above their 50-day or 200-day SMAs.
However, despite those bearish divergences, my proprietary indicators of supply and demand and various advance/decline lines have confirmed the S&P’s rally.
Resistance
The weekly Dow Jones (NYSEArca: DIA) chart below shows significant overhead resistance provided by two long-term trend lines/channels.
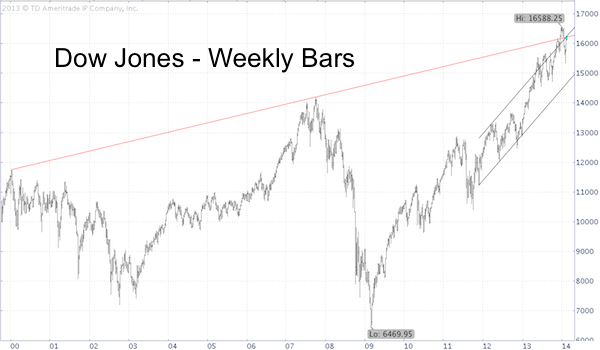
So far, the Dow Jones remains below this resistance level.
RSI Divergences
The S&P 500 chart below is an updated version of a projection first published in the February 3 and 5 Profit Radar Report.
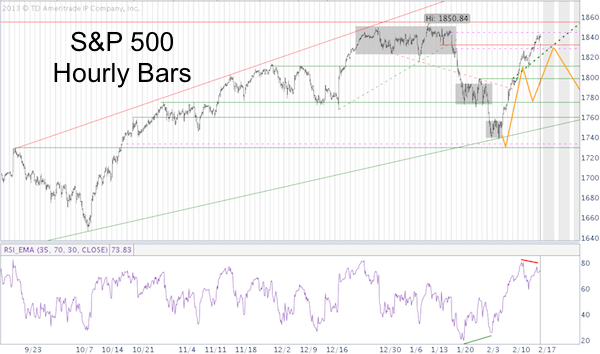
Based on the assessment that: “There was a bullish RSI divergence. Selling pressure is subsiding. The potential for a roaring rally exists,” the Profit Radar Report expected a strong rally toward S&P 1,830.
Obviously, the S&P 500 (NYSEArca: SPY) has exceeded 1,830, but the general projection is still holding true and we are seeing a bearish RSI divergence on the hourly chart.
Based on the above indicators (albeit lonely, it standouts among the sea of green signals) this could be just a deep retracement rally followed by new lows.
How common are deep retracement rallies. Here’s a look at the most recent ones and how the S&P 500 fared thereafter:
Deep Retracement - The Last Hope for Bears
Simon Maierhofer is the publisher of the Profit Radar Report. The Profit Radar Report presents complex market analysis (S&P 500, Dow Jones, gold, silver, euro and bonds) in an easy format. Technical analysis, sentiment indicators, seasonal patterns and common sense are all wrapped up into two or more easy-to-read weekly updates. All Profit Radar Report recommendations resulted in a 59.51% net gain in 2013.
Follow Simon on Twitter @ iSPYETF or sign up for the FREE iSPYETF Newsletter to get actionable ETF trade ideas delivered for free.

|
