It’s a cliché, but true, when it comes to stock market cycles: “Those who don’t learn from history may be doomed to repeat it.”
Stock market cycles allow us to project history into the future. You can’t argue with proven history, either it happened or it didn’t.
The question is how accurately can historical patterns project the future?
Without beating around the bush, let’s take a look at two powerful S&P 500 (SNP: ^GSPC) cycles.
The log scale S&P 500 chart below reveals a 7-year and 13-year boom/bust cycle.
This chart was one of many featured in the Profit Radar Report's 2014 stock market forecast (other components include various seasonality charts, sentiment charts, technical support/resistance charts, etc. and an actual projection of 2014 based on the composite message of all indicators).
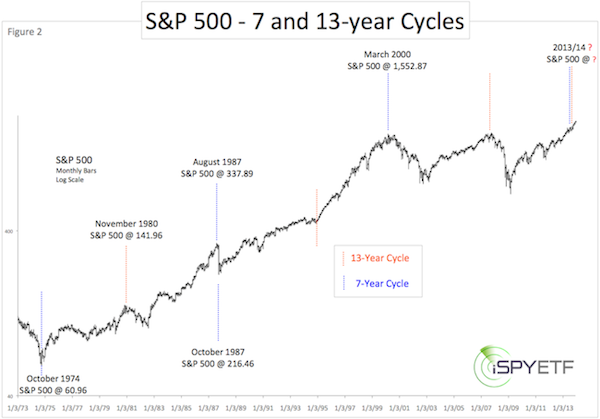
The dotted blue (7-year cycle) and orange (13-year cycle) show that major market tops and bottoms occurred in 6-7 year increments since 1974.
The only exception is 1994. The cycle didn’t cause a major high or low, but it was by no means a failure as 1994 was the launch pad for the biggest bull market in history of the Dow Jones (DJI: ^DJI) and S&P 500 (NYSEArca: SPY).
Black Monday and the ominous 1987 market crash occurred 7 years after the 1980 top, and 13 years after the 1974 bottom.
The 2000 top unraveled 6 years after the 1994 low and 13 years after the 1987 crash.
Based on the 13-year cycles, there should have been a major top in 2013, but 2014 is 7 years after the 2007 top.
Central bank liquidity may have stretched the 13-year cycle.
Stretched, Postponed or Enhanced?
We don’t know what causes the 7-and 13-year cycles, but there’s no doubt that the S&P 500 (and Dow Jones) have closely adhered to them in the past.
Will the S&P continue to stick to the beat of its cycles in the future?
The QE bull market is already 58 months old. The average bull ‘dies’ at age 39.
The S&P 500 and Dow Jones January Barometer (as January goes, so goes the year) caution of a tough year ahead.
The S&P 500 and Dow Jones broke their December lows, which on average leads to another 11% decline.
The obvious question now is whether this correction is the beginning of the end?
The Profit Radar Report's 2014 Forecast provides the answer to this question along with a detailed forecast and actual chart projection for 2014. The 2014 Forecast is based on technical analysis and indicators, investor sentiment and money flow, seasonality and cycles, Elliott Wave Theory, support/resistance levels, presence and absence of reliable divergences and more.
Simon Maierhofer is the publisher of the Profit Radar Report. The Profit Radar Report presents complex market analysis (S&P 500, Dow Jones, gold, silver, euro and bonds) in an easy format. Technical analysis, sentiment indicators, seasonal patterns and common sense are all wrapped up into two or more easy-to-read weekly updates. All Profit Radar Report recommendations resulted in a 59.51% net gain in 2013.
Follow Simon on Twitter @ iSPYETF or sign up for the FREE iSPYETF Newsletter to get actionable ETF trade ideas delivered for free.

|
