“Buy the best and forget the rest.” This is the mission statement of the Profit Radar Report. “Buying the best” doesn’t refer to the best stocks but to the best profit opportunities.
The quality of trade setups is more important than the quantity, but how do you spot a quality setup? The next few paragraphs highlight three actual quality opportunities for gold, silver and the S&P 500,
Before we delve into the actual charts, I’d like to define what makes a quality setup.
1) High probability trade: I follow three key market forecasting elements (continuous coverage provided via the Profit Radar Report):
I) Technicals
II) sentiment
III) seasonality.
A high probability setup only happens when all three indicators point in the same direction. Using this technique I identified the following high probability trades:
Sell: April 2010, May 2011 – Buy: March 2009, October 2011, June 2012.
It’s comparatively rare for my three key indicators to align. But that doesn’t mean there aren’t any quality setups.
2) Low-risk trade: A low-risk setup is a trade with significantly higher profit potential than risk of losses. That’s because the entry point is very close to key support or resistance, which provides a powerful and well-defined stop-loss level.
We haven’t had a high probability set up in nearly half a year, so the quality setups highlighted below are all classified as low-risk trades.
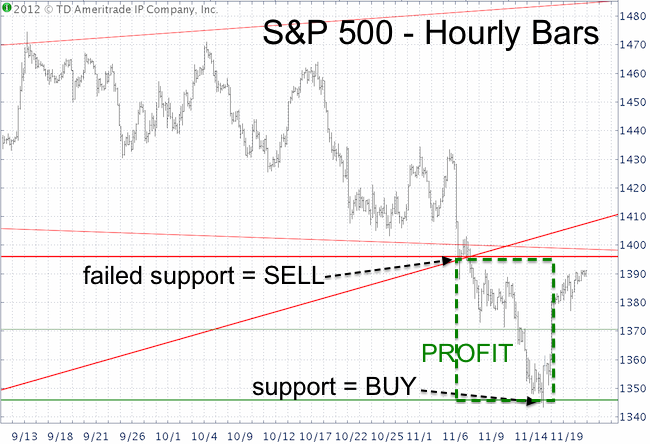
S&P 500
The S&P 500 reached our revised up side target of 1,475 on September 14, the day after the Fed announced QE3. We didn’t go short at 1,475 because the new recovery came come absent of a bearish RSI divergence (the April 2010, May 2011 and May 2012 highs were all market by bearish RSI divergences).
The initial phase of the decline was very choppy and difficult to trade. Key support was at 1,396. The November 7 Profit Radar Report warned that: “A move below 1,394 will be a signal to go short with a stop-loss around 1,405.”
The November 14 Profit Radar Report recommended to: “Place a stop order to close half of our short position at 1,348 to take profits.” The second half was closed out at 1,371.
We closed our positions for a 46 and 27 S&P point profit. At no time was the risk greater than 10 points. The 27 – 46 point gain wasn’t as great as if we entered earlier, but we had a favorable risk/reward ratio and most importantly low-risk profits.
Corresponding ETFs are the Short S&P 500 ProShares (SH), UltraShort S&P 500 ProShares (SDS) or the S&P 500 SPDR (SPY).
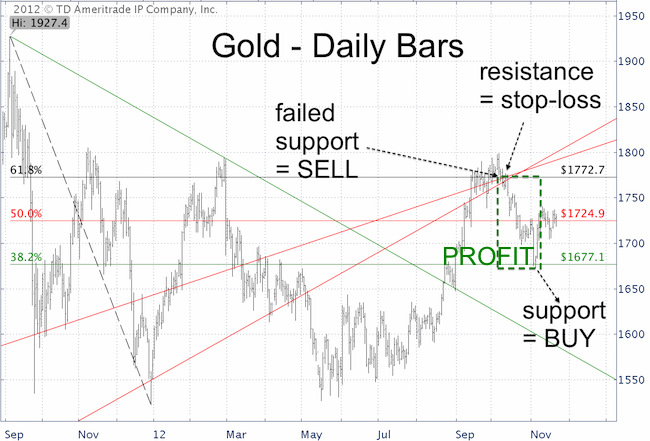
Gold
In early October gold was sitting atop quadruple support but sentiment had become frothy. The October 7 Profit Radar Report stated:
“According to the latest Commitments of Traders (COT) report, small speculators are now holding the most net long gold positions in a quarter century. Friday’s action also produced a red candle high. Both developments are generally bearish. However, as mentioned in Wednesday’s PRR, gold prices remain above quadruple support (2 trend lines, 20-day SMA, and 61.8% Fibonacci). As long as prices remain above support we’ll give this rally the benefit of the doubt. A move/close below 1,765 will be a signal to go short for aggressive investors with a stop-loss at 1,775” (later raised to 1,777).
When should we take profits? The October 25 Profit Radar Report said this: “Gold dropped to support at 1,700 today. We are getting to a point where it becomes tempting to lock in a 65-point gain. Since gold hasn’t seen a daily bullish RSI divergence yet either, we’ll hold our short position. We’ll sell half of our holdings at 1,680.
We sold half of the gold position at 1,675 in early November and the second half at 1,725 a few days later and captured a 5% and 2.5% profit. Corresponding ETF trades were a) short the SPDR Gold Shares (GLD) or b) buy the UltraShort Gold ProShares ETF (GLL).
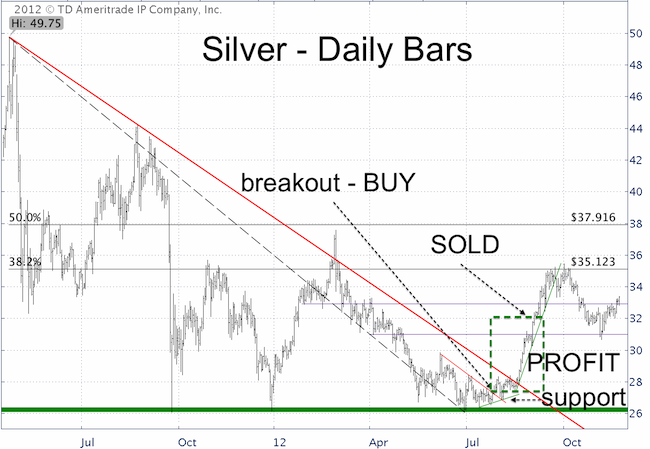
Silver
Silver broke above trend line support on July 25 at 27.30. This was a buy signal. Our stop-loss was at no time more than 2% below the entry price (initially red, than green trend line).
In hindsight we could have held on to the position as long as the sharply ascending green trend line remained in tact, but hindsight is 20/20.
We closed the position around 30 and 32 for a 10% and 16% gain in the iShares Silver Trust (SLV).
Future low-risk and high probability trade signals are available via the Profit Radar Report.
|
