Subscribers to iSPYETF’s free e-mail newsletter receive a market outlook, usually once a week. The market outlook below was sent out on February 10, 2022. If you’d like to sign up for the free e-newsletter, you may do so here (we will never share your e-mail with anyone, just as we don't accept advertising).
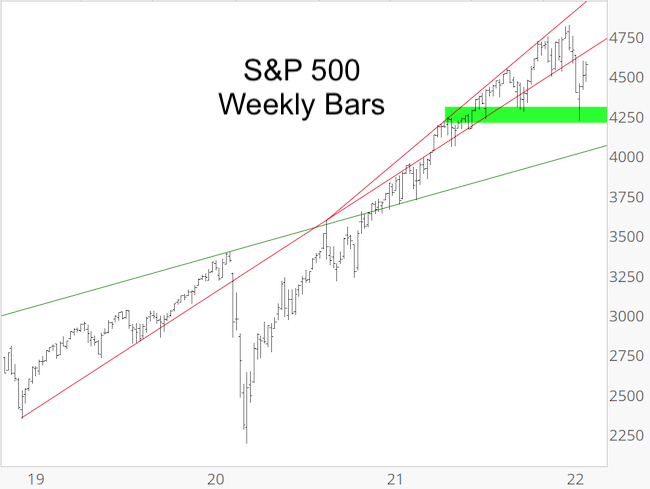
The January 30 Profit Radar Report stated that: "Once the S&P 500 reaches the up side target (4,500 - 4,600) we'll assess whether new all-time highs or another leg lower are next."
The S&P is still in that resistance zone.

The S&P already bounced over 350 points from January's low, fooling many bears (we were not one of them). Nevertheless, the month of January entered history books with a steep 5.25% loss.
Many consider this the January Barometer: As January goes so goes the rest of the year (invented and popularized by StockTradersAlmanac).
Other barometers are the Santa Claus Rally (last 5 days of the old and first 2 days of the new year) and the first 5 days of January.
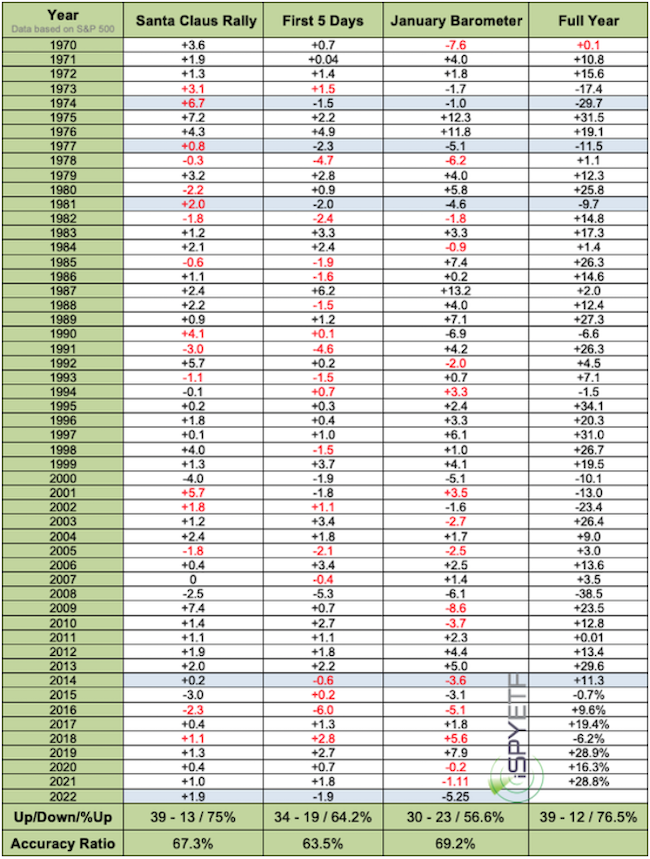
The table below shows the performance of all three barometers. Red numbers mean that the barometer was incorrect. As the table at the bottom shows, the accuracy ratio, since 1970, is 60% - 70%.
Highlighted in blue are other years, there were 4, when the Santa Claus rally was up, and the first 5 days of January and the entire January were down (as this time around). 3 of 4 years, the S&P ended the year with a loss.

The above data is interesting, but it's not a key ingredient of my analysis. I calculate and tabulate performance to get an objective read on indicators and barometers (StockTradersAlmanac cherry picks a bit and claims the January barometer has 90% accuracy).
I won't present a 'faulty 90% accurate' indicator to my subscribers. There are some very high probability studies and indicators, and when I mention them they are tested and factual.
Since we're talking about seasonality, I find the average S&P 500 performance for mid years of the election cycle more helpful. It actually harmonizes with many of the indicators and is available in the 2022 S&P 500 Forecast.
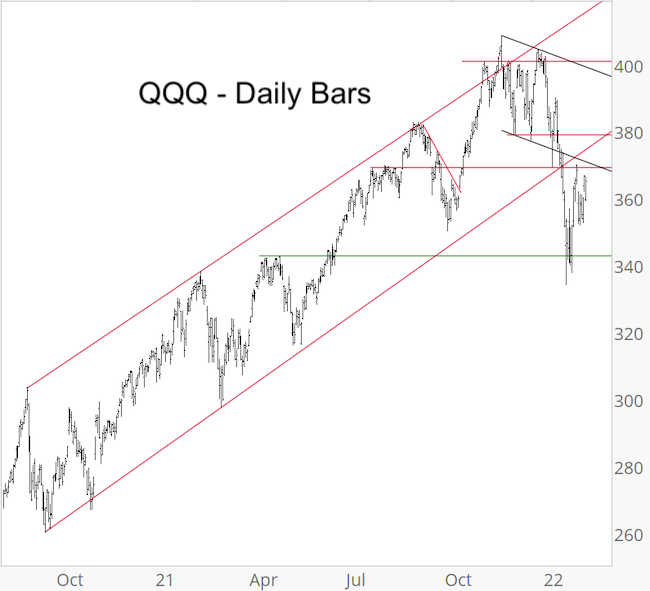
QQQ bounced from the support outlined weeks ago and is now approaching noteworthy resistance.

In summary, most indexes have reached resistance which could spark a pullback, the 'messy' bearish option outlined last week is still possible.
Continuous updates, the 2022 S&P 500 Forecast and out-of-the box technical and historical analysis is available via the Profit Radar Report.
The Profit Radar Report comes with a 30-day money back guarantee, but fair warning: 90% of users stay on beyond 30 days.
Barron's rates iSPYETF a "trader with a good track record," and Investor's Business Daily writes "Simon says and the market is playing along."
|