Subscribers to iSPYETF’s free e-mail newsletter receive a market outlook, usually once a week. The market outlook below was sent out on November 5. If you’d like to sign up for the free e-newsletter, you may do so here.
Will the 'Election Pop' Last?
Wednesday delivered the biggest post presidential election Tuesday pop ever! The S&P 500 gained 2.2%, yet only 45% of NYSE volume went into advancing stocks and only 55% of NYSE-traded stocks actually closed the day higher.
This is another first. Since 1970, the S&P has never rallied more than 2% with less than 50% of volume moving into advancing stocks. Interesting times!
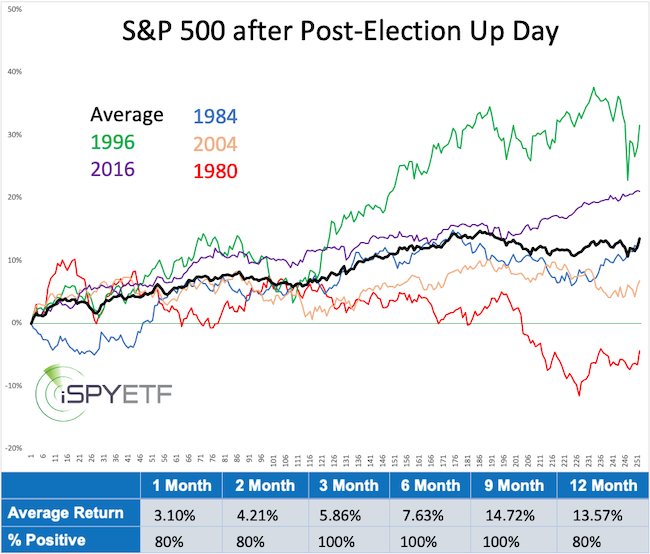
Anyway, going back to the post-election pop: Of the 22 presidential elections since 1932, the S&P 500 was up the day after election Tuesday, 10 times, and down 12 times. The chart and performance tracker below shows the forward performance after the 5 post-election up days since 1970.
Conversely, when the S&P 500 was down the day after election Tuesday, the forward performance was negative 75% of the time 2 weeks later and 50% of the time 3 months later. So a good first day has generally been a good omen (in a pandemic-free world).
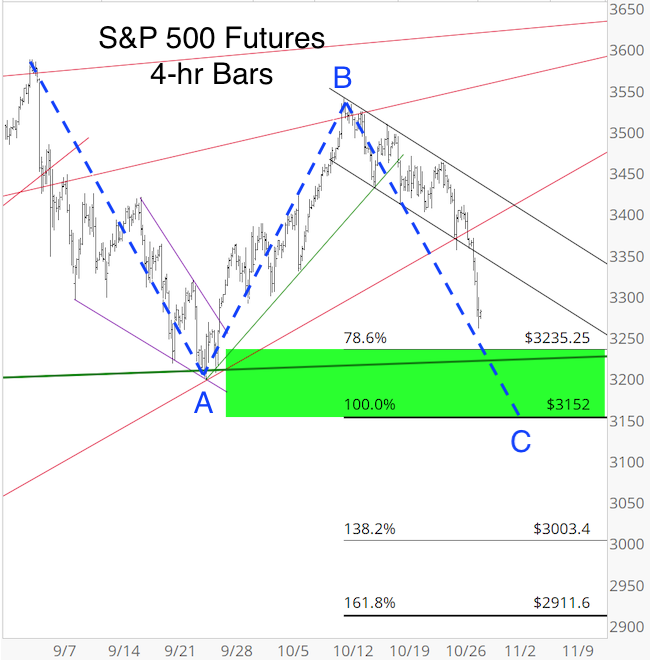
The last few Market Outlooks monitored the progress of the A-B-C decline from the September 2 high. Here is the Profit Radar Report's assessment from October 28:
"The green area on the 4-hr S&P 500 Futures chart shows a general target area for wave C. Wave C would equal wave A at 3,152 (dashed blue lines). Waves C tend to either fall short or exceed the prior wave A low to some degree.
Wave 3 of 3 (of C) may have concluded at today’s low. A couple more up/down sequences (waves 4 and 5) into the 3,235 - 3,152 range could conclude the leg lower, and if investors like the election results this correction.
S&P 500 Futures are up some 20 points in after hours trading, likely the start of a bounce."
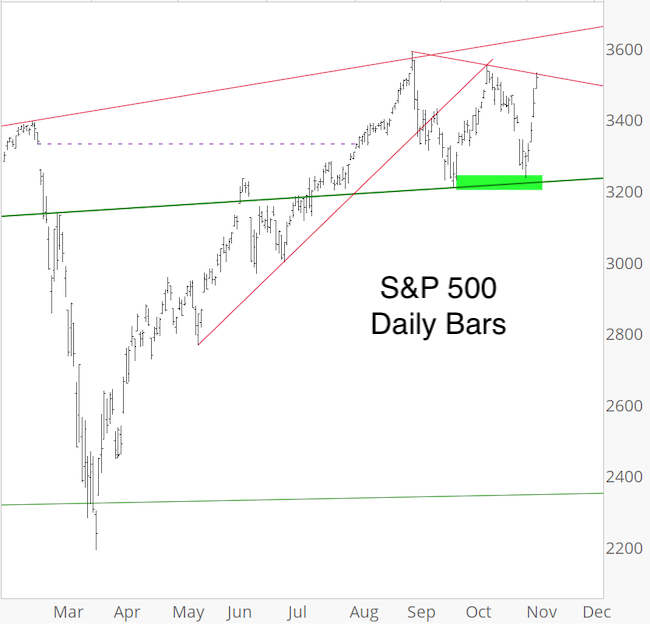
As the bigger picture chart of the the S&P 500 below shows, price fell into the green support zone and jumped from there ... and is now nearing a resistance zone. Sustained trade above resistance will likely eliminate any mid-term bearish Elliott Wave patterns, but as long as resistance holds, it should be respected.
Continued updates along with the most likely long-term forward path (this was just published) are available via the Profit Radar Report.
The Profit Radar Report comes with a 30-day money back guarantee, but fair warning: 90% of users stay on beyond 30 days.
Barron's rates iSPYETF a "trader with a good track record," and Investor's Business Daily writes "Simon says and the market is playing along."
|
